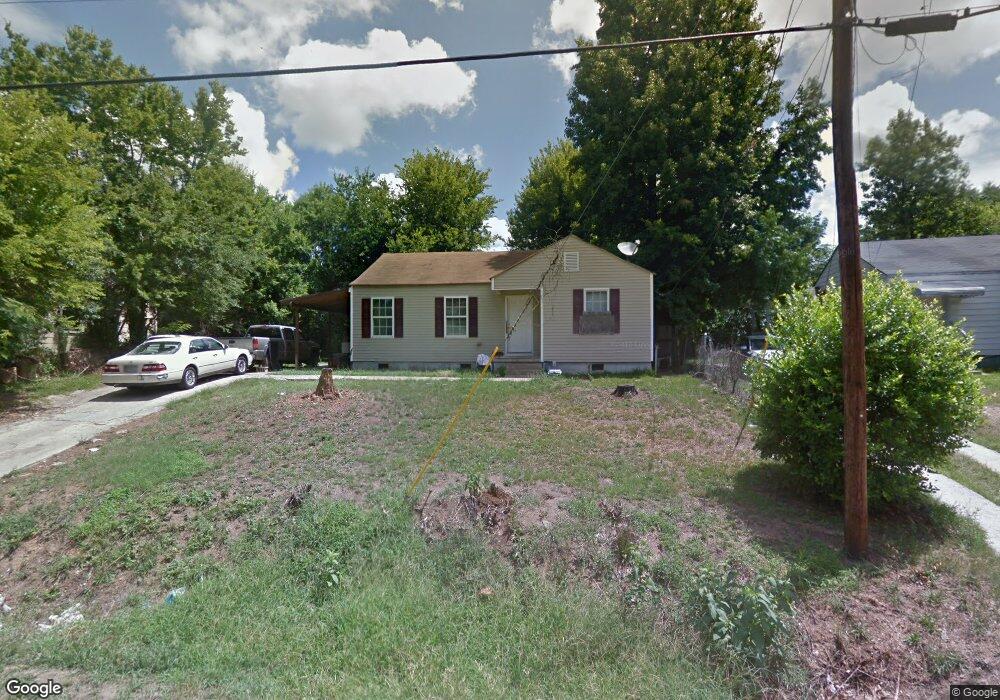
993 Perdue St Macon, GA 31206
Estimated Value: $59,000 - $62,000
4
Beds
2
Baths
1,300
Sq Ft
$47/Sq Ft
Est. Value
About This Home
This home is located at 993 Perdue St, Macon, GA 31206 and is currently estimated at $60,767, approximately $46 per square foot. 993 Perdue St is a home located in Bibb County with nearby schools including Ingram-Pye Elementary School, Southwest High School, and Cirrus Charter Academy.
Ownership History
Date
Name
Owned For
Owner Type
Purchase Details
Closed on
Oct 24, 2018
Sold by
Jackson Deirdre
Bought by
Chaney Mathis Denayne
Current Estimated Value
Purchase Details
Closed on
Aug 28, 2017
Sold by
Chaney Mathis and Patterson Rosa
Bought by
Jackson Deirpre Danyell
Purchase Details
Closed on
Jun 1, 2016
Sold by
Williams Gary
Bought by
Chaney Mathis and Patterson Rosa
Purchase Details
Closed on
Nov 1, 2010
Sold by
Simmons Leroy
Bought by
Williams Gary
Purchase Details
Closed on
May 17, 2007
Sold by
Williams Gary G
Bought by
Simmons Leroy
Purchase Details
Closed on
Feb 22, 2005
Sold by
Andre Gerard
Bought by
Williams Gary
Purchase Details
Closed on
Sep 20, 2004
Purchase Details
Closed on
Mar 9, 2004
Create a Home Valuation Report for This Property
The Home Valuation Report is an in-depth analysis detailing your home's value as well as a comparison with similar homes in the area
Home Values in the Area
Average Home Value in this Area
Purchase History
| Date | Buyer | Sale Price | Title Company |
|---|---|---|---|
| Chaney Mathis Denayne | -- | None Available | |
| Jackson Deirpre Danyell | -- | None Available | |
| Chaney Mathis | -- | -- | |
| Williams Gary | -- | None Available | |
| Simmons Leroy | -- | None Available | |
| Williams Gary | -- | None Available | |
| -- | $49,500 | -- | |
| -- | $10,000 | -- |
Source: Public Records
Tax History Compared to Growth
Tax History
| Year | Tax Paid | Tax Assessment Tax Assessment Total Assessment is a certain percentage of the fair market value that is determined by local assessors to be the total taxable value of land and additions on the property. | Land | Improvement |
|---|---|---|---|---|
| 2025 | $524 | $21,321 | $1,600 | $19,721 |
| 2024 | $541 | $21,321 | $1,600 | $19,721 |
| 2023 | $599 | $20,225 | $1,600 | $18,625 |
| 2022 | $501 | $14,466 | $1,392 | $13,074 |
| 2021 | $440 | $11,590 | $1,252 | $10,338 |
| 2020 | $344 | $8,854 | $1,252 | $7,602 |
| 2019 | $347 | $8,854 | $1,252 | $7,602 |
| 2018 | $690 | $8,506 | $904 | $7,602 |
| 2017 | $319 | $8,506 | $904 | $7,602 |
| 2016 | $323 | $9,336 | $974 | $8,362 |
| 2015 | $457 | $9,336 | $974 | $8,362 |
| 2014 | $526 | $9,336 | $974 | $8,362 |
Source: Public Records
Map
Nearby Homes
- 981 Perdue St
- 968 Quinlan Dr
- 999 Ponce de Leon Cir N
- 997 Ponce de Leon Cir N
- 932 Quinlan Dr
- 946 Ponce de Leon Cir
- 982 Ponce de Leon Cir S
- 3141 Edlay Place
- 3210 Evergreen Dr
- 3064 Margaret Dr
- 3242 Evergreen Dr
- 837 Lackey Dr
- 3005 Margaret Dr
- 797 Newberg Ave
- 823 Ponce de Leon Ave
- 780 Ponce de Leon Ave
- 730 Newberg Ave
- 3158 Brownell Ave
- 725 Saint James Ave
- 1138 Newberg Ave
- 987 Perdue St
- 997 Perdue St
- 962 Quinlan Dr
- 956 Quinlan Dr
- 986 Ponce de Leon Cir N
- 974 Quinlan Dr
- 980 Ponce de Leon Cir N
- 975 Perdue St
- 950 Quinlan Dr
- 996 Ponce de Leon Cir S
- 994 Ponce de Leon Cir S
- 969 Perdue St
- 944 Quinlan Dr
- 991 Ponce de Leon Cir N
- 968 Perdue St
- 938 Quinlan Dr
- 995 Ponce de Leon Cir N
- 954 Ponce de Leon Cir N
- 963 Perdue St
- 988 Ponce de Leon Cir S