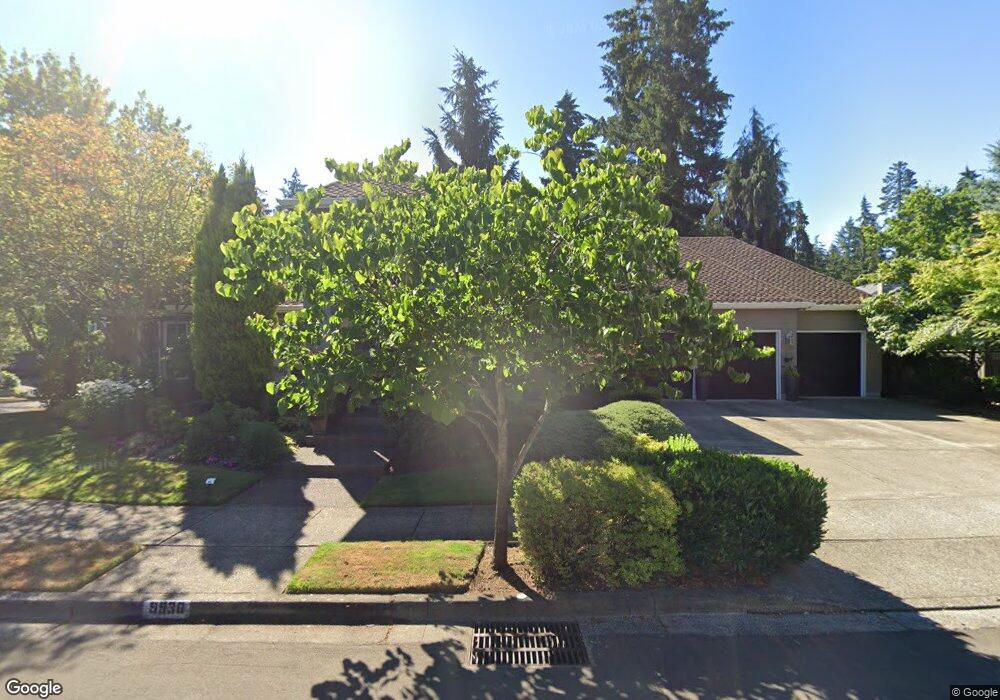
9930 SW Lumbee Ln Tualatin, OR 97062
Estimated Value: $967,066 - $1,149,000
5
Beds
4
Baths
3,627
Sq Ft
$288/Sq Ft
Est. Value
About This Home
This home is located at 9930 SW Lumbee Ln, Tualatin, OR 97062 and is currently estimated at $1,044,017, approximately $287 per square foot. 9930 SW Lumbee Ln is a home located in Washington County with nearby schools including Byrom Elementary School, Hazelbrook Middle School, and Tualatin High School.
Ownership History
Date
Name
Owned For
Owner Type
Purchase Details
Closed on
Aug 3, 2016
Sold by
Smith Gregory D and Smith Linda S
Bought by
Smith Gregory D and Smith Linda S
Current Estimated Value
Purchase Details
Closed on
Apr 14, 1997
Sold by
Young David M and Young Jane S
Bought by
Smith Gregory D and Smith Linda S
Home Financials for this Owner
Home Financials are based on the most recent Mortgage that was taken out on this home.
Original Mortgage
$300,000
Outstanding Balance
$37,470
Interest Rate
7.5%
Estimated Equity
$1,006,547
Purchase Details
Closed on
Aug 27, 1996
Sold by
Cascade West Construction Corp
Bought by
Young David M and Young Jane S
Home Financials for this Owner
Home Financials are based on the most recent Mortgage that was taken out on this home.
Original Mortgage
$324,800
Interest Rate
5.87%
Purchase Details
Closed on
Jan 23, 1996
Sold by
Matrix Development Corp
Bought by
Cascade West Construction Corp
Create a Home Valuation Report for This Property
The Home Valuation Report is an in-depth analysis detailing your home's value as well as a comparison with similar homes in the area
Home Values in the Area
Average Home Value in this Area
Purchase History
| Date | Buyer | Sale Price | Title Company |
|---|---|---|---|
| Smith Gregory D | -- | None Available | |
| Smith Gregory D | $404,000 | Stewart Title Company | |
| Young David M | $406,000 | Chicago Title | |
| Cascade West Construction Corp | $80,900 | First American |
Source: Public Records
Mortgage History
| Date | Status | Borrower | Loan Amount |
|---|---|---|---|
| Open | Smith Gregory D | $300,000 | |
| Previous Owner | Young David M | $324,800 |
Source: Public Records
Tax History Compared to Growth
Tax History
| Year | Tax Paid | Tax Assessment Tax Assessment Total Assessment is a certain percentage of the fair market value that is determined by local assessors to be the total taxable value of land and additions on the property. | Land | Improvement |
|---|---|---|---|---|
| 2025 | $12,461 | $732,630 | -- | -- |
| 2024 | $12,135 | $711,300 | -- | -- |
| 2023 | $12,135 | $690,590 | $0 | $0 |
| 2022 | $11,610 | $690,590 | $0 | $0 |
| 2021 | $10,957 | $650,960 | $0 | $0 |
| 2020 | $10,463 | $632,000 | $0 | $0 |
| 2019 | $10,505 | $613,600 | $0 | $0 |
| 2018 | $10,179 | $595,730 | $0 | $0 |
| 2017 | $9,301 | $578,380 | $0 | $0 |
| 2016 | $8,798 | $561,540 | $0 | $0 |
| 2015 | $8,375 | $545,190 | $0 | $0 |
| 2014 | $8,188 | $529,320 | $0 | $0 |
Source: Public Records
Map
Nearby Homes
- 22615 SW Miami Dr
- 22556 SW 96th Dr
- 22538 SW 96th Dr
- 22250 SW 103rd Ave
- 9240 SW Stono Dr
- 22040 SW Grahams Ferry Rd Unit B
- 22030 SW Grahams Ferry Rd Unit D
- 22000 SW Grahams Ferry Rd Unit C
- 22382 SW 107th Ave
- 10727 SW Nelson St
- 23045 SW 89th Ave
- Magnolia Plan at Autumn Sunrise - The Ridgeline Collection
- Aubrey Plan at Autumn Sunrise - The Meadow Collection
- Dawson Plan at Autumn Sunrise - The Canyon Collection
- Bainbridge Plan at Autumn Sunrise - The Trailside Collection
- Stella Plan at Autumn Sunrise - The Canyon Collection
- Ashland Plan at Autumn Sunrise - The Ridgeline Collection
- Kingston Plan at Autumn Sunrise - The Meadow Collection
- Mulberry Plan at Autumn Sunrise - The Trailside Collection
- Blairmont Plan at Autumn Sunrise - The Meadow Collection
- 22835 SW Eno Place
- 22920 SW Miami Place
- 22830 SW Eno Relisted
- 22930 SW Miami Place
- 9945 SW Lumbee Ln
- 22855 SW Eno Place
- 9965 SW Lumbee Ln
- 9860 SW Lumbee Ln
- 22830 SW Eno Place
- 22830 SW Eno Pl Bring Offers
- 22950 SW Miami Place Vrm
- 22950 SW Miami Place
- 22850 SW Eno Place
- 9875 SW Lumbee Ln
- 22820 SW Miami Dr 4sell Comm Unit 1
- 22765 SW Eno Place
- 22820 SW Miami Dr
- 22865 SW Eno Place
- 22790 SW Miami 4bac
- 9840 SW Lumbee Ln