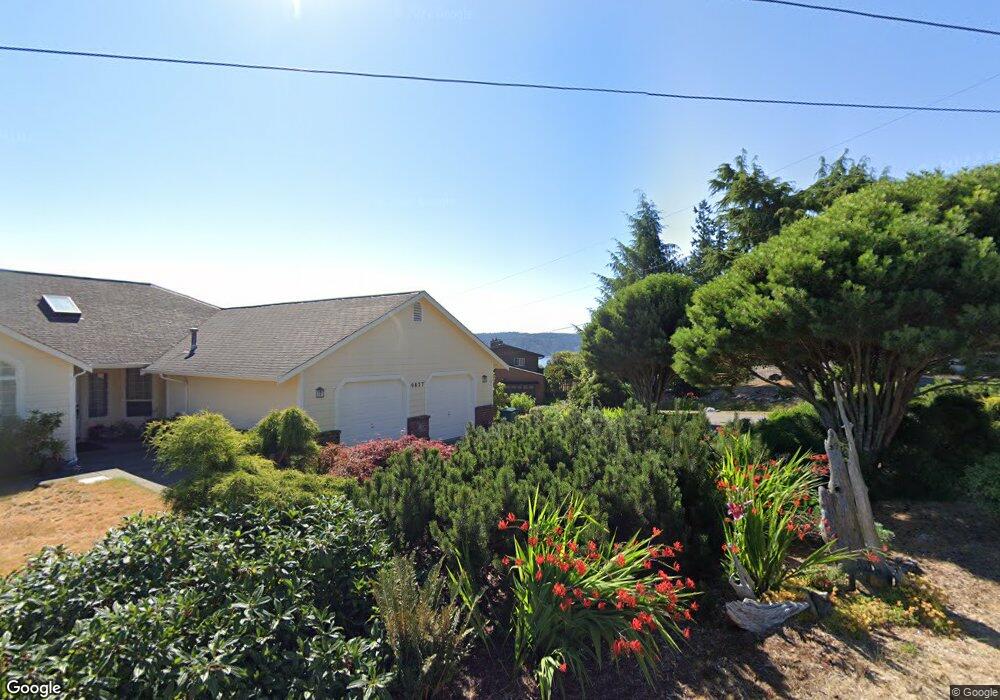
9932 Cove Way SE Port Orchard, WA 98367
Estimated Value: $614,858 - $762,000
3
Beds
2
Baths
2,184
Sq Ft
$316/Sq Ft
Est. Value
About This Home
This home is located at 9932 Cove Way SE, Port Orchard, WA 98367 and is currently estimated at $690,715, approximately $316 per square foot. 9932 Cove Way SE is a home located in Kitsap County with nearby schools including South Colby Elementary School, John Sedgwick Middle School, and South Kitsap High School.
Ownership History
Date
Name
Owned For
Owner Type
Purchase Details
Closed on
Jun 6, 2002
Sold by
Martin Steven D and Martin Karen R
Bought by
Painter William and Painter Beverly
Current Estimated Value
Home Financials for this Owner
Home Financials are based on the most recent Mortgage that was taken out on this home.
Original Mortgage
$138,400
Outstanding Balance
$58,601
Interest Rate
6.83%
Estimated Equity
$632,114
Purchase Details
Closed on
Jun 3, 1997
Sold by
Sangrey William J and Sangrey Shirley J
Bought by
Martin Steven D and Martin Karen R
Home Financials for this Owner
Home Financials are based on the most recent Mortgage that was taken out on this home.
Original Mortgage
$123,960
Interest Rate
8.08%
Create a Home Valuation Report for This Property
The Home Valuation Report is an in-depth analysis detailing your home's value as well as a comparison with similar homes in the area
Home Values in the Area
Average Home Value in this Area
Purchase History
| Date | Buyer | Sale Price | Title Company |
|---|---|---|---|
| Painter William | $173,000 | First American Title Ins | |
| Martin Steven D | $154,950 | Charter Title Corp |
Source: Public Records
Mortgage History
| Date | Status | Borrower | Loan Amount |
|---|---|---|---|
| Open | Painter William | $138,400 | |
| Previous Owner | Martin Steven D | $123,960 |
Source: Public Records
Tax History Compared to Growth
Tax History
| Year | Tax Paid | Tax Assessment Tax Assessment Total Assessment is a certain percentage of the fair market value that is determined by local assessors to be the total taxable value of land and additions on the property. | Land | Improvement |
|---|---|---|---|---|
| 2026 | $4,715 | $539,350 | $118,660 | $420,690 |
| 2025 | $4,715 | $539,350 | $118,660 | $420,690 |
| 2024 | $4,567 | $538,650 | $118,660 | $419,990 |
| 2023 | $4,537 | $538,650 | $118,660 | $419,990 |
| 2022 | $4,351 | $432,580 | $94,930 | $337,650 |
| 2021 | $4,047 | $380,190 | $84,760 | $295,430 |
| 2020 | $3,714 | $338,310 | $75,000 | $263,310 |
| 2019 | $3,147 | $314,190 | $69,600 | $244,590 |
| 2018 | $3,335 | $257,170 | $63,000 | $194,170 |
| 2017 | $2,839 | $257,170 | $63,000 | $194,170 |
| 2016 | $2,772 | $229,690 | $60,000 | $169,690 |
| 2015 | $2,684 | $225,360 | $60,000 | $165,360 |
| 2014 | -- | $180,890 | $68,450 | $112,440 |
| 2013 | -- | $180,890 | $68,450 | $112,440 |
Source: Public Records
Map
Nearby Homes
- 6928 SE View Park Rd
- 0 Lot 3 SE Yeshua Ln
- 10526 SE Vashon Vista Dr
- 9415 SE Goat Trail Rd
- 6556 Mariposa Ln SE
- 7095 Wilson Creek Rd SE
- 6599 Buttercup Ln SE
- 7099 Wilson Creek Rd SE
- 4920 Peterson Rd SE
- 8755 Landing Ln SE
- 4294 Siana Place SE
- 9300 Rustic Rock Ln SE
- 4554 Westway Dr SE
- 12423 SW 151st St
- 4464 Eastway Dr SE
- 4071 Ridge Crest Way SE
- 11212 SW 125th St
- 3449 Viewsound Ln SE
- 10110 SE Southworth Dr
- 16305 Crescent Dr SW
- 9960 Cove Way SE
- 9878 Cove Way SE
- 9877 Cove Way SE
- 6751 View Dr SE
- 6670 View Dr SE
- 10109 Cove Way SE
- 10113 Cove Way SE
- 10103 Cove Way SE
- 10125 Cove Way SE
- 6767 View Dr SE
- 10091 Cove Way SE
- 10085 Cove Way SE
- 6660 View Dr SE
- 6640 View Dr SE
- 6730 View Dr SE
- 10079 Cove Way SE
- 10075 Cove Way SE
- 6752 View Dr SE
- 6775 View Dr SE