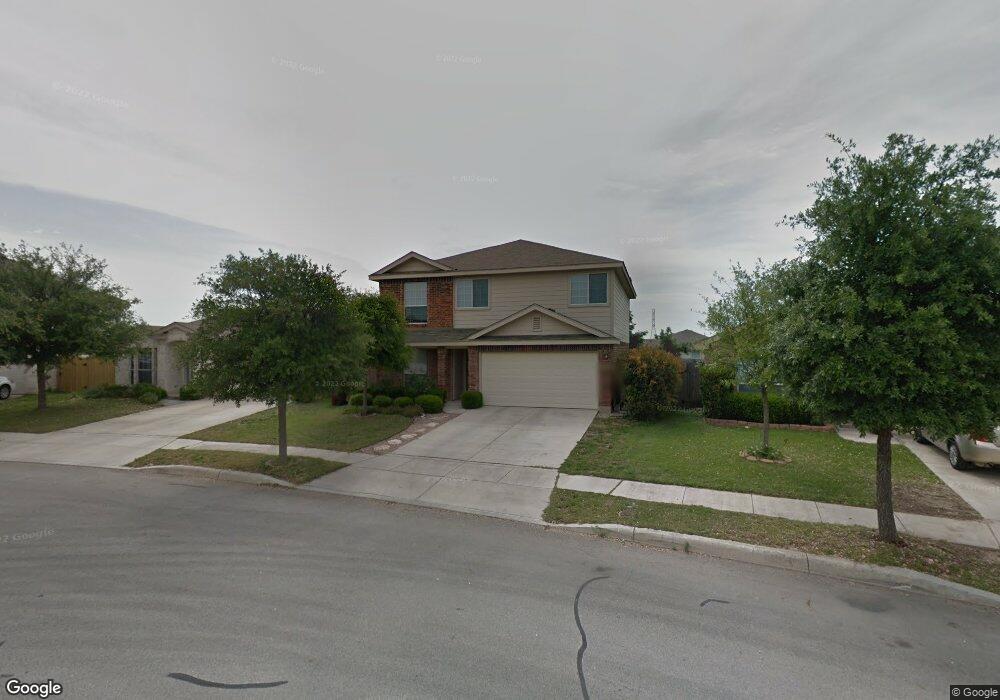
9932 Spring Beauty San Antonio, TX 78254
Estimated Value: $307,378 - $329,000
3
Beds
3
Baths
2,346
Sq Ft
$137/Sq Ft
Est. Value
About This Home
This home is located at 9932 Spring Beauty, San Antonio, TX 78254 and is currently estimated at $321,345, approximately $136 per square foot. 9932 Spring Beauty is a home located in Bexar County with nearby schools including Krueger Elementary School, Jefferson Middle School, and School of Science and Technology Hill Country.
Ownership History
Date
Name
Owned For
Owner Type
Purchase Details
Closed on
Nov 9, 2009
Sold by
Cipriano Kristin Suzanne
Bought by
St Cyr Sue L
Current Estimated Value
Home Financials for this Owner
Home Financials are based on the most recent Mortgage that was taken out on this home.
Original Mortgage
$146,200
Outstanding Balance
$94,973
Interest Rate
4.9%
Mortgage Type
New Conventional
Estimated Equity
$226,372
Purchase Details
Closed on
Oct 26, 2007
Sold by
Cipriano Guillermo
Bought by
Cipriano Kristin Suzanne
Purchase Details
Closed on
Mar 12, 2004
Sold by
Continental Homes Of Texas Lp
Bought by
Martinez Guillermo Cipriano and Cipriano Kristin Suzanne
Home Financials for this Owner
Home Financials are based on the most recent Mortgage that was taken out on this home.
Original Mortgage
$158,172
Interest Rate
5.71%
Mortgage Type
VA
Create a Home Valuation Report for This Property
The Home Valuation Report is an in-depth analysis detailing your home's value as well as a comparison with similar homes in the area
Home Values in the Area
Average Home Value in this Area
Purchase History
| Date | Buyer | Sale Price | Title Company |
|---|---|---|---|
| St Cyr Sue L | -- | Ttt | |
| Cipriano Kristin Suzanne | -- | None Available | |
| Martinez Guillermo Cipriano | -- | -- |
Source: Public Records
Mortgage History
| Date | Status | Borrower | Loan Amount |
|---|---|---|---|
| Open | St Cyr Sue L | $146,200 | |
| Previous Owner | Martinez Guillermo Cipriano | $158,172 | |
| Closed | Cipriano Kristin Suzanne | $0 |
Source: Public Records
Tax History Compared to Growth
Tax History
| Year | Tax Paid | Tax Assessment Tax Assessment Total Assessment is a certain percentage of the fair market value that is determined by local assessors to be the total taxable value of land and additions on the property. | Land | Improvement |
|---|---|---|---|---|
| 2025 | $4,678 | $327,810 | $54,650 | $273,160 |
| 2024 | $4,678 | $327,810 | $54,650 | $273,160 |
| 2023 | $4,678 | $302,185 | $54,650 | $280,280 |
| 2022 | $4,923 | $274,714 | $45,590 | $272,740 |
| 2021 | $4,954 | $249,740 | $41,460 | $208,280 |
| 2020 | $5,152 | $239,580 | $41,460 | $198,120 |
| 2019 | $5,189 | $233,670 | $33,200 | $200,470 |
| 2018 | $4,867 | $218,990 | $33,200 | $185,790 |
| 2017 | $4,725 | $212,170 | $33,200 | $178,970 |
| 2016 | $4,585 | $205,860 | $33,200 | $172,660 |
| 2015 | $3,726 | $193,213 | $33,200 | $162,250 |
| 2014 | $3,726 | $175,648 | $0 | $0 |
Source: Public Records
Map
Nearby Homes
- 9951 Sandlet Trail
- 9950 Sandlet Trail
- 9807 Sandlet Trail
- 10627 Arabian Sands
- 10523 Timber Country
- 10707 Arabian Sands
- 9607 Country Shadow
- 10322 Filly Valley
- 10706 Pharaoh Run
- 10707 Pharaoh Run
- 10814 Shetland Hills
- 10767 Pharaoh Run
- 10511 Marengo Ln
- 9427 Velvet Spring
- 9726 Palomino Oaks
- 11019 Palomino Bend
- 9714 Connemara Bend
- 10225 Braun Rd Unit A201
- 10225 Braun Rd Unit A310
- 10225 Braun Rd Unit C601
- 9928 Spring Beauty
- 9936 Spring Beauty
- 9924 Spring Beauty
- 9939 Sandlet Trail
- 9931 Sandlet Trail
- 9943 Sandlet Trail
- 9940 Spring Beauty
- 9927 Sandlet Trail
- 9920 Spring Beauty
- 9947 Sandlet Trail
- 9923 Sandlet Trail
- 9916 Spring Beauty
- 9919 Sandlet Trail
- 9933 Spring Beauty
- 9929 Spring Beauty
- 9955 Sandlet Trail
- 9915 Sandlet Trail
- 9945 Spring Beauty
- 9912 Spring Beauty
- 9921 Spring Beauty