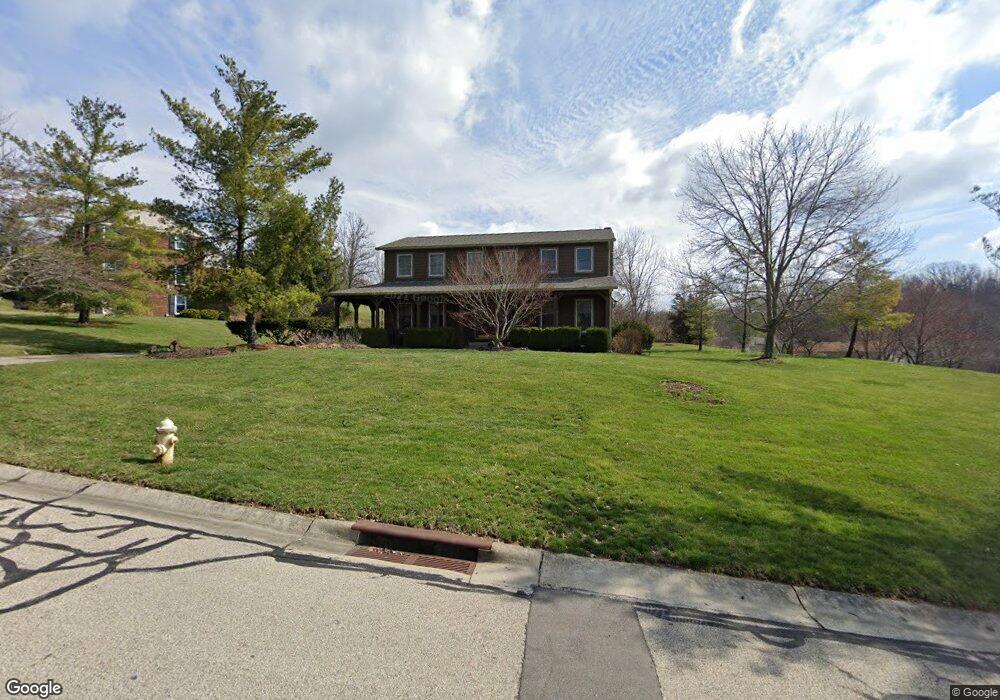
9934 Pebbleknoll Dr Cincinnati, OH 45252
Estimated Value: $445,343 - $493,000
4
Beds
3
Baths
2,832
Sq Ft
$169/Sq Ft
Est. Value
About This Home
This home is located at 9934 Pebbleknoll Dr, Cincinnati, OH 45252 and is currently estimated at $477,586, approximately $168 per square foot. 9934 Pebbleknoll Dr is a home located in Hamilton County with nearby schools including Colerain Elementary School, Colerain Middle School, and Colerain High School.
Ownership History
Date
Name
Owned For
Owner Type
Purchase Details
Closed on
Nov 11, 2002
Sold by
Cendant Mobility Financial Corp
Bought by
Bryson M David and Bryson Jeannette N
Current Estimated Value
Home Financials for this Owner
Home Financials are based on the most recent Mortgage that was taken out on this home.
Original Mortgage
$208,100
Outstanding Balance
$88,445
Interest Rate
6.22%
Estimated Equity
$389,141
Purchase Details
Closed on
Jun 17, 2002
Sold by
Borders Richard L and Borders Pamela
Bought by
Cendant Mobility Financial Corp
Purchase Details
Closed on
Jun 28, 1996
Sold by
Witt Ronald M
Bought by
Borders Richard L and Carr Borders Pamela L
Home Financials for this Owner
Home Financials are based on the most recent Mortgage that was taken out on this home.
Original Mortgage
$120,000
Interest Rate
8.07%
Create a Home Valuation Report for This Property
The Home Valuation Report is an in-depth analysis detailing your home's value as well as a comparison with similar homes in the area
Home Values in the Area
Average Home Value in this Area
Purchase History
| Date | Buyer | Sale Price | Title Company |
|---|---|---|---|
| Bryson M David | $244,900 | Advanced Land Title Agency L | |
| Cendant Mobility Financial Corp | $254,000 | Advanced Land Title Agency L | |
| Borders Richard L | $205,000 | -- |
Source: Public Records
Mortgage History
| Date | Status | Borrower | Loan Amount |
|---|---|---|---|
| Open | Bryson M David | $208,100 | |
| Previous Owner | Borders Richard L | $120,000 |
Source: Public Records
Tax History Compared to Growth
Tax History
| Year | Tax Paid | Tax Assessment Tax Assessment Total Assessment is a certain percentage of the fair market value that is determined by local assessors to be the total taxable value of land and additions on the property. | Land | Improvement |
|---|---|---|---|---|
| 2024 | $6,230 | $115,371 | $19,250 | $96,121 |
| 2023 | $6,264 | $115,371 | $19,250 | $96,121 |
| 2022 | $5,810 | $87,273 | $19,075 | $68,198 |
| 2021 | $5,759 | $87,273 | $19,075 | $68,198 |
| 2020 | $5,818 | $87,273 | $19,075 | $68,198 |
| 2019 | $5,714 | $80,066 | $17,500 | $62,566 |
| 2018 | $5,130 | $80,066 | $17,500 | $62,566 |
| 2017 | $4,863 | $80,066 | $17,500 | $62,566 |
| 2016 | $4,513 | $73,231 | $16,625 | $56,606 |
| 2015 | $4,556 | $73,231 | $16,625 | $56,606 |
| 2014 | $4,564 | $73,231 | $16,625 | $56,606 |
| 2013 | $4,584 | $77,084 | $17,500 | $59,584 |
Source: Public Records
Map
Nearby Homes
- 5077 Pebblevalley Dr
- 9908 Pebbleknoll Dr
- 9873 Kittywood Dr
- 9940 Prechtel Rd
- 10054 Prechtel Rd
- 9864 Prechtel Rd
- 9858 Prechtel Rd
- 9901 Regatta Dr
- 9905 Regatta Dr
- 4493 Summerwind Ct
- 5630 Dry Ridge Rd
- 4302 Courageous Cir Unit 83
- 4352 Courageous Cir Unit 59
- 9897 Skyridge Dr
- 4281 Defender Dr
- 9940 Regatta Dr
- 4280 Defender Dr
- 4200 Endeavor Dr
- 4220 Endeavor Dr
- 4198 Intrepid Dr
- 9952 Pebbleknoll Dr
- 9964 Pebbleknoll Dr
- 5031 Pebblevalley Dr
- 9927 Pebbleknoll Dr
- 9935 Pebbleknoll Dr
- 9951 Pebbleknoll Dr
- 9974 Pebbleknoll Dr
- 5043 Pebblevalley Dr
- 9911 Pebbleknoll Dr
- 9943 Pebbleknoll Dr
- 9959 Pebbleknoll Dr
- 5055 Pebblevalley Dr
- 9980 Pebbleknoll Dr
- 9919 Pebbleknoll Dr
- 9967 Pebbleknoll Dr
- 9975 Pebbleknoll Dr
- 5067 Pebblevalley Dr
- 9915 Pebbleknoll Dr
- 5024 Pebblevalley Dr
- 5012 Pebblevalley Dr