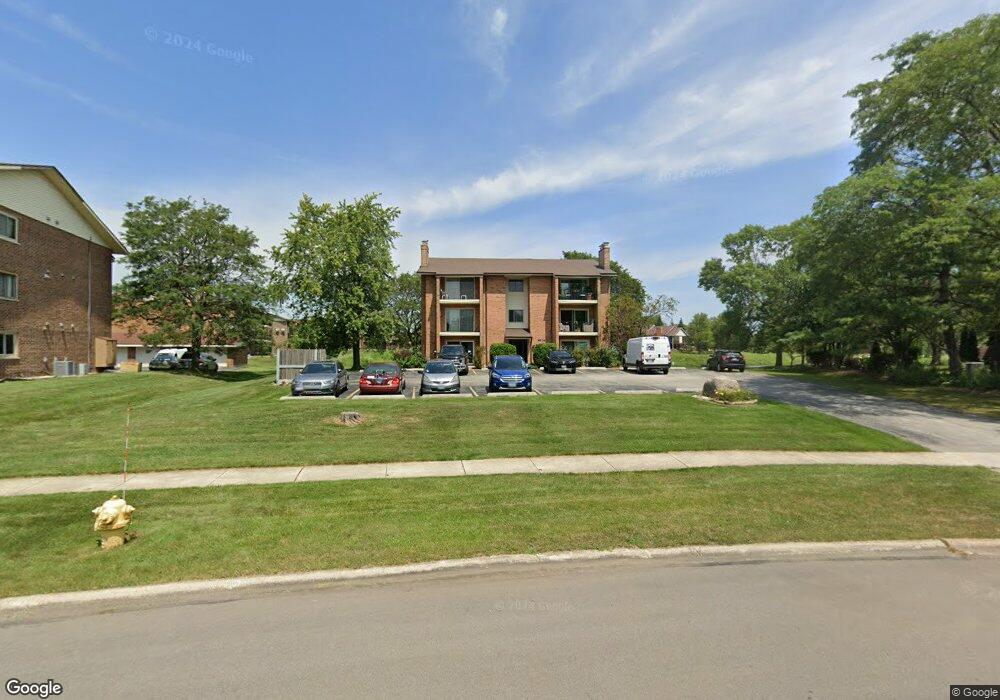
9934 Treetop Dr Unit 3603 Orland Park, IL 60462
Orland Grove NeighborhoodEstimated Value: $195,000 - $216,000
2
Beds
2
Baths
1,220
Sq Ft
$168/Sq Ft
Est. Value
About This Home
This home is located at 9934 Treetop Dr Unit 3603, Orland Park, IL 60462 and is currently estimated at $204,806, approximately $167 per square foot. 9934 Treetop Dr Unit 3603 is a home located in Cook County with nearby schools including Orland Park Elementary School, High Point Elementary School, and Orland Jr High School.
Ownership History
Date
Name
Owned For
Owner Type
Purchase Details
Closed on
Oct 21, 2022
Sold by
Wilson Stacey
Bought by
Morley John T and Morley Arlene
Current Estimated Value
Purchase Details
Closed on
Feb 14, 2008
Sold by
Wilson Dennis and Wilson Stacey A
Bought by
Wilson Stacey
Home Financials for this Owner
Home Financials are based on the most recent Mortgage that was taken out on this home.
Original Mortgage
$116,725
Interest Rate
5.75%
Mortgage Type
New Conventional
Purchase Details
Closed on
Jun 1, 2000
Sold by
Precin Scott W and Precin Denise M
Bought by
Wilson Dennis and Wilson Stacey A
Home Financials for this Owner
Home Financials are based on the most recent Mortgage that was taken out on this home.
Original Mortgage
$94,400
Interest Rate
8.14%
Mortgage Type
FHA
Create a Home Valuation Report for This Property
The Home Valuation Report is an in-depth analysis detailing your home's value as well as a comparison with similar homes in the area
Home Values in the Area
Average Home Value in this Area
Purchase History
| Date | Buyer | Sale Price | Title Company |
|---|---|---|---|
| Morley John T | $165,000 | None Listed On Document | |
| Wilson Stacey | -- | Greater Illinois Title | |
| Wilson Dennis | $105,000 | -- |
Source: Public Records
Mortgage History
| Date | Status | Borrower | Loan Amount |
|---|---|---|---|
| Previous Owner | Wilson Stacey | $116,725 | |
| Previous Owner | Wilson Dennis | $94,400 |
Source: Public Records
Tax History Compared to Growth
Tax History
| Year | Tax Paid | Tax Assessment Tax Assessment Total Assessment is a certain percentage of the fair market value that is determined by local assessors to be the total taxable value of land and additions on the property. | Land | Improvement |
|---|---|---|---|---|
| 2024 | $4,066 | $16,248 | $1,579 | $14,669 |
| 2023 | $3,394 | $16,248 | $1,579 | $14,669 |
| 2022 | $3,394 | $11,330 | $1,292 | $10,038 |
| 2021 | $3,278 | $11,329 | $1,292 | $10,037 |
| 2020 | $3,155 | $11,329 | $1,292 | $10,037 |
| 2019 | $3,175 | $11,568 | $1,148 | $10,420 |
| 2018 | $3,088 | $11,568 | $1,148 | $10,420 |
| 2017 | $3,018 | $11,568 | $1,148 | $10,420 |
| 2016 | $2,912 | $10,436 | $1,076 | $9,360 |
| 2015 | $2,884 | $10,436 | $1,076 | $9,360 |
| 2014 | $2,841 | $10,436 | $1,076 | $9,360 |
| 2013 | $3,302 | $12,882 | $1,076 | $11,806 |
Source: Public Records
Map
Nearby Homes
- 9910 Treetop Dr Unit 3904
- 9925 Shady Ln Unit 5001
- 9925 Shady Ln Unit 5004
- 9726 W 154th St
- 10021 El Cameno Real Dr
- 15301 Wilshire Dr
- 15168 Franchesca Ln
- 15106 West Ave
- 10227 Hilltop Dr
- 15059 Hale Dr
- 15060 Hale Dr
- 9939 Constitution Ct
- 10330 Hilltop Dr
- 10300 W 159th St
- 15373 Sheffield Square Pkwy
- 10587 W 154th Place
- 10652 153rd Place
- 9314 Wherry Ln Unit D
- 10617 Owain Way
- 15511 Westminster Dr Unit 65B
- 9934 Treetop Dr Unit 2W
- 9934 Treetop Dr Unit 3601
- 9934 Treetop Dr Unit 3605
- 9934 Treetop Dr Unit 3604
- 9934 Treetop Dr Unit 3606
- 9934 Treetop Dr Unit 3602
- 9934 Treetop Dr
- 9934 Treetop Dr Unit 2E
- 9934 Treetop Dr Unit 1E
- 9942 Treetop Dr Unit 2E
- 9942 Treetop Dr Unit 3503
- 9942 Treetop Dr Unit 3504
- 9942 Treetop Dr Unit 3506
- 9942 Treetop Dr Unit 3505
- 9942 Treetop Dr Unit 3502
- 9942 Treetop Dr Unit 3501
- 9942 Treetop Dr Unit 3E
- 9942 Treetop Dr Unit 1W
- 9942 Treetop Dr Unit 2W
- 9942 Treetop Dr Unit 1E