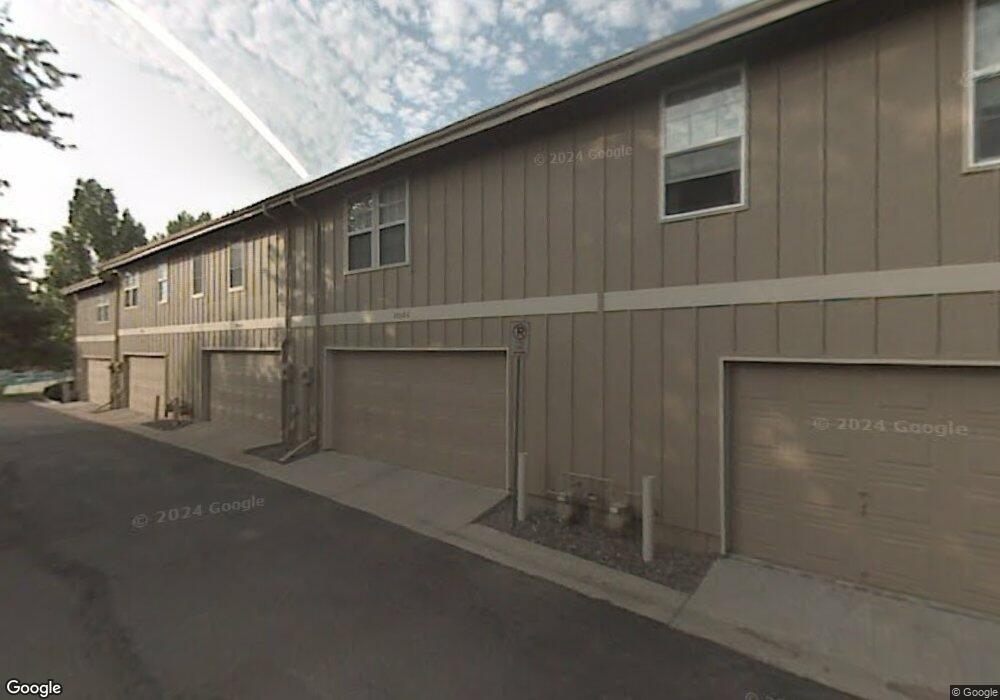
9938 Grove Way Unit C Westminster, CO 80031
Hyland Greens NeighborhoodEstimated Value: $389,341 - $455,000
3
Beds
2
Baths
1,412
Sq Ft
$296/Sq Ft
Est. Value
About This Home
This home is located at 9938 Grove Way Unit C, Westminster, CO 80031 and is currently estimated at $417,585, approximately $295 per square foot. 9938 Grove Way Unit C is a home located in Adams County with nearby schools including Rocky Mountain Elementary School, Silver Hills Middle School, and Northglenn High School.
Ownership History
Date
Name
Owned For
Owner Type
Purchase Details
Closed on
Oct 28, 2015
Sold by
Camalick Tamara J
Bought by
The Tamara J Camalick Trust
Current Estimated Value
Purchase Details
Closed on
Aug 11, 2003
Sold by
Camalick Tamara J and Camalick John J
Bought by
Camalick Tamara J
Home Financials for this Owner
Home Financials are based on the most recent Mortgage that was taken out on this home.
Original Mortgage
$143,250
Interest Rate
6.31%
Mortgage Type
Unknown
Purchase Details
Closed on
Dec 8, 1998
Sold by
Camalick John J and Camalick Tamara J
Bought by
Camalick John J and Camalick Tamara J
Purchase Details
Closed on
Feb 1, 1994
Sold by
Camalick Tamara J
Bought by
Camalick Tamara J and Camalick John J
Purchase Details
Closed on
Jan 28, 1994
Sold by
Kagie H J and Kagie Janet L
Bought by
Camalick Tamara J
Purchase Details
Closed on
Jul 23, 1992
Create a Home Valuation Report for This Property
The Home Valuation Report is an in-depth analysis detailing your home's value as well as a comparison with similar homes in the area
Home Values in the Area
Average Home Value in this Area
Purchase History
| Date | Buyer | Sale Price | Title Company |
|---|---|---|---|
| The Tamara J Camalick Trust | -- | None Available | |
| Camalick Tamara J | -- | Land Title Guarantee Company | |
| Camalick John J | -- | -- | |
| Camalick Tamara J | -- | Land Title | |
| Camalick Tamara J | $104,500 | Land Title | |
| -- | $95,000 | -- |
Source: Public Records
Mortgage History
| Date | Status | Borrower | Loan Amount |
|---|---|---|---|
| Previous Owner | Camalick Tamara J | $143,250 |
Source: Public Records
Tax History Compared to Growth
Tax History
| Year | Tax Paid | Tax Assessment Tax Assessment Total Assessment is a certain percentage of the fair market value that is determined by local assessors to be the total taxable value of land and additions on the property. | Land | Improvement |
|---|---|---|---|---|
| 2024 | $2,338 | $25,320 | $5,940 | $19,380 |
| 2023 | $2,313 | $27,470 | $4,600 | $22,870 |
| 2022 | $2,306 | $21,940 | $4,730 | $17,210 |
| 2021 | $2,382 | $21,940 | $4,730 | $17,210 |
| 2020 | $2,281 | $21,430 | $4,860 | $16,570 |
| 2019 | $2,286 | $21,430 | $4,860 | $16,570 |
| 2018 | $2,179 | $19,760 | $2,090 | $17,670 |
| 2017 | $1,966 | $19,760 | $2,090 | $17,670 |
| 2016 | $1,686 | $16,430 | $2,310 | $14,120 |
| 2015 | $1,684 | $16,430 | $2,310 | $14,120 |
| 2014 | -- | $13,160 | $2,310 | $10,850 |
Source: Public Records
Map
Nearby Homes
- 9850 N Federal Blvd Unit 59
- 10058 Grove Ct Unit E
- 3431 W 98th Dr Unit A
- 9778 Irving Ct
- 2925 Hawk St Unit 88
- 2960 Alder St Unit 341
- 9661 Green Ct Unit C
- 10014 Clay St
- 9824 Meade Cir
- 2810 Cascade Dr Unit 10
- 3803 W 99th Ave
- 10332 Julian St
- 3190 W 95th Ave
- 2853 Blue Jay St Unit 147
- 9775 Lark St
- 10001 Alcott St
- 10114 Meade Ct
- 10316 Meade Loop
- 3320 Kassler Place
- 9623 Meade Ct
- 9938 Grove Way Unit A
- 9938 Grove Way Unit D
- 9938 Grove Way Unit E
- 9938 Grove Way Unit F
- 9958 Grove Way Unit D
- 9958 Grove Way Unit B
- 9958 Grove Way Unit A
- 9948 Grove Way Unit A
- 9948 Grove Way Unit B
- 9948 Grove Way Unit C
- 9948 Grove Way Unit D
- 9948 Grove Way Unit E
- 9928 Grove Way Unit A
- 9928 Grove Way Unit B
- 9928 Grove Way Unit C
- 9928 Grove Way Unit D
- 9918 Grove Way Unit D
- 9918 Grove Way Unit C
- 9918 Grove Way Unit B
- 9918 Grove Way Unit A