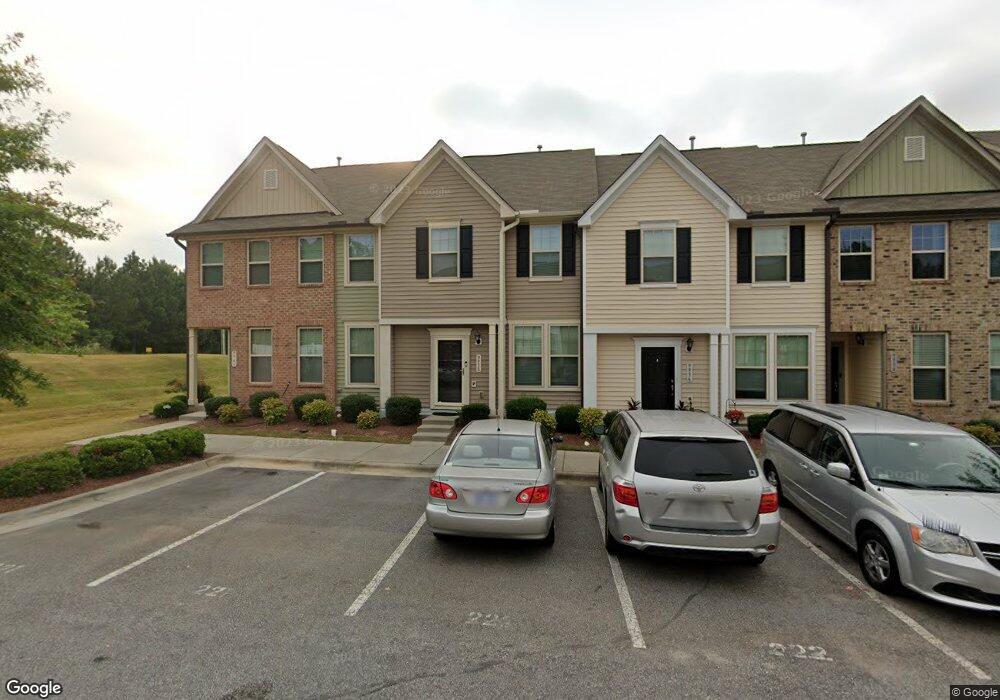
9938 Sweet Basil Dr Unit LOT 00.0222 Wake Forest, NC 27587
Estimated Value: $283,000 - $295,000
3
Beds
3
Baths
1,500
Sq Ft
$192/Sq Ft
Est. Value
About This Home
This home is located at 9938 Sweet Basil Dr Unit LOT 00.0222, Wake Forest, NC 27587 and is currently estimated at $288,090, approximately $192 per square foot. 9938 Sweet Basil Dr Unit LOT 00.0222 is a home located in Wake County with nearby schools including Sanford Creek Elementary School, Wake Forest-Rolesville Middle School, and Wake Forest High School.
Ownership History
Date
Name
Owned For
Owner Type
Purchase Details
Closed on
Dec 22, 2021
Sold by
Curry D Janis D and Curry Dorothy Janis
Bought by
Chalasani Sai Charan
Current Estimated Value
Home Financials for this Owner
Home Financials are based on the most recent Mortgage that was taken out on this home.
Original Mortgage
$283,100
Outstanding Balance
$259,921
Interest Rate
2.98%
Mortgage Type
New Conventional
Estimated Equity
$28,169
Purchase Details
Closed on
Jul 17, 2019
Sold by
Nikolov Rumen and Nikolov Boryana
Bought by
Curry D Janid
Purchase Details
Closed on
Dec 8, 2016
Sold by
Dan Ryan Builders
Bought by
Nikolov Rumen and Nikolov Boryana
Home Financials for this Owner
Home Financials are based on the most recent Mortgage that was taken out on this home.
Original Mortgage
$8,093
Interest Rate
3.47%
Mortgage Type
Unknown
Create a Home Valuation Report for This Property
The Home Valuation Report is an in-depth analysis detailing your home's value as well as a comparison with similar homes in the area
Home Values in the Area
Average Home Value in this Area
Purchase History
| Date | Buyer | Sale Price | Title Company |
|---|---|---|---|
| Chalasani Sai Charan | $298,000 | None Available | |
| Curry D Janid | $195,500 | None Available | |
| Nikolov Rumen | $165,000 | None Available |
Source: Public Records
Mortgage History
| Date | Status | Borrower | Loan Amount |
|---|---|---|---|
| Open | Chalasani Sai Charan | $283,100 | |
| Previous Owner | Nikolov Rumen | $8,093 | |
| Previous Owner | Nikolov Rumen | $161,860 |
Source: Public Records
Tax History Compared to Growth
Tax History
| Year | Tax Paid | Tax Assessment Tax Assessment Total Assessment is a certain percentage of the fair market value that is determined by local assessors to be the total taxable value of land and additions on the property. | Land | Improvement |
|---|---|---|---|---|
| 2025 | $2,945 | $307,420 | $70,000 | $237,420 |
| 2024 | $2,934 | $307,420 | $70,000 | $237,420 |
| 2023 | $2,129 | $181,474 | $30,000 | $151,474 |
| 2022 | $2,043 | $181,474 | $30,000 | $151,474 |
| 2021 | $1,014 | $181,474 | $30,000 | $151,474 |
| 2020 | $2,007 | $181,474 | $30,000 | $151,474 |
| 2019 | $1,828 | $145,755 | $28,000 | $117,755 |
| 2018 | $1,732 | $145,755 | $28,000 | $117,755 |
| 2017 | $1,674 | $28,000 | $28,000 | $0 |
Source: Public Records
Map
Nearby Homes
- 4205 Ginger Sprout Dr
- 2725 Gross Ave
- 2806 Gross Ave
- 8508 Parlange Woods Ln
- 2933 Grandview Heights Ln
- 10859 Bedfordtown Dr
- 3123 Winding Waters Way
- 3100 Lariat Ridge Dr
- 8911 Elizabeth Benneth Place
- 2709 Willow Pines Place
- 2516 Brighthaven Dr
- 3100 Thurman Dairy Loop
- 11006 Connally Ln
- 8947 Commons Townes Dr
- 2313 Filigree Ct
- 11309 Shadow Elms Ln
- 3116 Thurman Dairy Loop
- 10714 Bedfordtown Dr
- 8957 Commons Townes Dr
- 2429 Falls River Ave
- 9936 Sweet Basil Dr Unit LOT 00.0223
- 9936 Sweet Basil Dr
- 9938 Sweet Basil Dr
- 9934 Sweet Basil Dr Unit LOT 00.0224
- 9940 Sweet Basil Dr
- 9940 Sweet Basil Dr Unit LOT 00.0221
- 9932 Sweet Basil Dr Unit Lot 00.0225
- 9932 Sweet Basil Dr
- 9930 Sweet Basil Dr Unit Lot 00.0226
- 9930 Sweet Basil Dr
- 9937 Sweet Basil Dr Unit Lot 00.0218
- 9937 Sweet Basil Dr
- 9939 Sweet Basil Dr Unit LOT 00.0219
- 9939 Sweet Basil Dr
- 9935 Sweet Basil Dr Unit LOT 00.0217
- 9933 Sweet Basil Dr Unit Lot 00.0216
- 9933 Sweet Basil Dr
- 9941 Sweet Basil Dr
- 9941 Sweet Basil Dr Unit LOT 00.0220
- 9931 Sweet Basil Dr Unit Lot 00.0215