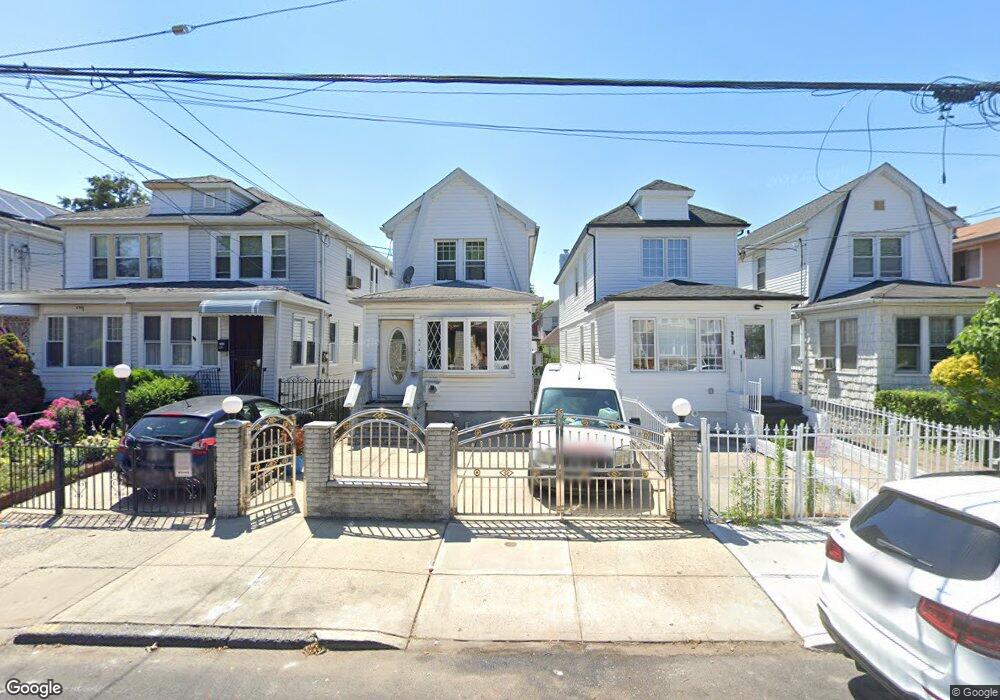
994 E 43rd St Brooklyn, NY 11210
Flatlands NeighborhoodEstimated Value: $751,338 - $833,000
Studio
--
Bath
1,414
Sq Ft
$567/Sq Ft
Est. Value
About This Home
This home is located at 994 E 43rd St, Brooklyn, NY 11210 and is currently estimated at $801,835, approximately $567 per square foot. 994 E 43rd St is a home located in Kings County with nearby schools including P.S. 109, Andries Hudde School, and Christian Heritage Academy.
Ownership History
Date
Name
Owned For
Owner Type
Purchase Details
Closed on
Jul 6, 2007
Sold by
Armstrong Richard
Bought by
Armstrong Richard and Armstrong Sherrie
Current Estimated Value
Purchase Details
Closed on
Aug 5, 1999
Sold by
Volny Maryse
Bought by
Armstrong Richard
Home Financials for this Owner
Home Financials are based on the most recent Mortgage that was taken out on this home.
Original Mortgage
$164,111
Interest Rate
8.11%
Mortgage Type
FHA
Create a Home Valuation Report for This Property
The Home Valuation Report is an in-depth analysis detailing your home's value as well as a comparison with similar homes in the area
Home Values in the Area
Average Home Value in this Area
Purchase History
| Date | Buyer | Sale Price | Title Company |
|---|---|---|---|
| Armstrong Richard | -- | -- | |
| Armstrong Richard | -- | -- | |
| Armstrong Richard | $165,500 | Washington Title Insurance C | |
| Armstrong Richard | $165,500 | Washington Title Insurance C |
Source: Public Records
Mortgage History
| Date | Status | Borrower | Loan Amount |
|---|---|---|---|
| Previous Owner | Armstrong Richard | $164,111 | |
| Closed | Armstrong Richard | $0 |
Source: Public Records
Tax History
| Year | Tax Paid | Tax Assessment Tax Assessment Total Assessment is a certain percentage of the fair market value that is determined by local assessors to be the total taxable value of land and additions on the property. | Land | Improvement |
|---|---|---|---|---|
| 2025 | $5,636 | $47,460 | $8,040 | $39,420 |
| 2024 | $5,636 | $41,460 | $8,040 | $33,420 |
| 2023 | $2,595 | $39,600 | $8,040 | $31,560 |
| 2022 | $5,457 | $32,400 | $8,040 | $24,360 |
| 2021 | $5,509 | $29,040 | $8,040 | $21,000 |
| 2020 | $2,575 | $30,600 | $8,040 | $22,560 |
| 2019 | $4,843 | $30,300 | $8,040 | $22,260 |
| 2018 | $4,590 | $23,976 | $6,096 | $17,880 |
| 2017 | $4,588 | $23,976 | $7,420 | $16,556 |
| 2016 | $4,286 | $22,988 | $7,180 | $15,808 |
| 2015 | $2,525 | $21,687 | $8,757 | $12,930 |
| 2014 | $2,525 | $20,460 | $8,940 | $11,520 |
Source: Public Records
Map
Nearby Homes
- 987 E 42nd St
- 1684 Troy Ave
- 1676 Troy Ave
- 1749 Albany Ave
- 4109 Avenue I
- 4204 Avenue I
- 4589 Kings Hwy
- 1065 E 39th St
- 1775 Troy Ave
- 4555 Kings Hwy
- 4702 Avenue I
- 1240 E 48th St
- 3708 Avenue H
- 1153 E 40th St
- 1353 E 46th St
- 1200 E 49th St
- 1548 Schenectady Ave
- 3816 Glenwood Rd
- 1144 E 37th St
- 1173 E 43rd St
Your Personal Tour Guide
Ask me questions while you tour the home.