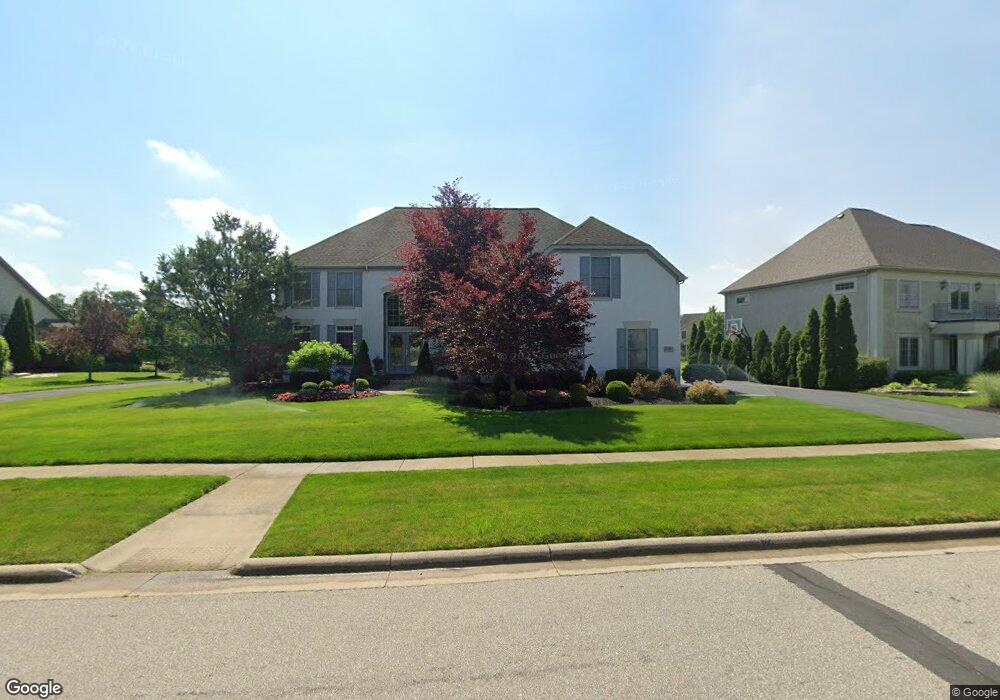
9941 Archer Ln Dublin, OH 43017
Concord NeighborhoodEstimated Value: $895,385 - $1,171,000
4
Beds
4
Baths
4,500
Sq Ft
$234/Sq Ft
Est. Value
About This Home
This home is located at 9941 Archer Ln, Dublin, OH 43017 and is currently estimated at $1,051,596, approximately $233 per square foot. 9941 Archer Ln is a home located in Delaware County with nearby schools including Eli Pinney Elementary School, Willard Grizzell Middle School, and Dublin Jerome High School.
Ownership History
Date
Name
Owned For
Owner Type
Purchase Details
Closed on
Aug 5, 2004
Sold by
Moultry Gerald L and Moultry Vickie H
Bought by
Jackson Randall E and Jackson Susan M
Current Estimated Value
Home Financials for this Owner
Home Financials are based on the most recent Mortgage that was taken out on this home.
Original Mortgage
$442,400
Outstanding Balance
$217,485
Interest Rate
5.87%
Mortgage Type
Purchase Money Mortgage
Estimated Equity
$834,111
Purchase Details
Closed on
Dec 22, 2003
Sold by
Bob Webb Tartan Fields Llc
Bought by
Moultry Gerald L and Moultry Vickie H
Home Financials for this Owner
Home Financials are based on the most recent Mortgage that was taken out on this home.
Original Mortgage
$455,375
Interest Rate
5.84%
Mortgage Type
Purchase Money Mortgage
Purchase Details
Closed on
Sep 30, 2003
Sold by
Bob Webb Builders Inc
Bought by
Bob Webb Tartan Fields Llc
Create a Home Valuation Report for This Property
The Home Valuation Report is an in-depth analysis detailing your home's value as well as a comparison with similar homes in the area
Home Values in the Area
Average Home Value in this Area
Purchase History
| Date | Buyer | Sale Price | Title Company |
|---|---|---|---|
| Jackson Randall E | $553,000 | Focus Title | |
| Moultry Gerald L | $569,300 | Stewart Title Agency Of Colu | |
| Bob Webb Tartan Fields Llc | -- | -- |
Source: Public Records
Mortgage History
| Date | Status | Borrower | Loan Amount |
|---|---|---|---|
| Open | Jackson Randall E | $442,400 | |
| Closed | Moultry Gerald L | $455,375 | |
| Closed | Jackson Randall E | $55,300 |
Source: Public Records
Tax History Compared to Growth
Tax History
| Year | Tax Paid | Tax Assessment Tax Assessment Total Assessment is a certain percentage of the fair market value that is determined by local assessors to be the total taxable value of land and additions on the property. | Land | Improvement |
|---|---|---|---|---|
| 2024 | $14,079 | $249,940 | $46,030 | $203,910 |
| 2023 | $14,015 | $249,940 | $46,030 | $203,910 |
| 2022 | $11,998 | $199,430 | $35,000 | $164,430 |
| 2021 | $12,201 | $199,430 | $35,000 | $164,430 |
| 2020 | $12,247 | $199,430 | $35,000 | $164,430 |
| 2019 | $13,187 | $191,590 | $35,000 | $156,590 |
| 2018 | $13,319 | $191,590 | $35,000 | $156,590 |
| 2017 | $12,177 | $185,400 | $32,590 | $152,810 |
| 2016 | $12,374 | $185,400 | $32,590 | $152,810 |
| 2015 | $12,320 | $185,400 | $32,590 | $152,810 |
| 2014 | $12,651 | $185,400 | $32,590 | $152,810 |
| 2013 | $12,444 | $180,960 | $32,590 | $148,370 |
Source: Public Records
Map
Nearby Homes
- 7022 Brodie Blvd
- 0 Sunset Dr
- 5681 Morlich Square
- 5640 Morlich Square
- 60 Buckeye Dr
- 6512 Harriott Rd
- Verona Plan at The Courtyards on Concord
- Torino Plan at The Courtyards on Concord
- Provenance Plan at The Courtyards on Concord
- Promenade Plan at The Courtyards on Concord
- 0 N Park Place W Unit 225035823
- 9190 Leith Dr
- 0 Dublin Rd Unit 225011118
- 35 E Muskingum Dr
- 35 E Pawnee Dr
- 9366 Muirkirk Dr
- 9280 Leith Dr
- 7931 Tillinghast Dr
- 5514 Loch More Ct E
- 10007 Allen Dr
- 9957 Archer Ln
- 9917 Archer Ln
- 9971 Archer Ln
- 7039 Robertson Ct
- 9905 Archer Ln
- 9914 Archer Ln
- 7002 Brodie Blvd
- 6984 Brodie Blvd
- 9964 Archer Ln
- 9999 Archer Ln
- 6968 Brodie Blvd
- 7073 Robertson Ct
- 7046 Robertson Ct
- 9891 Archer Ln
- 9892 Archer Ln
- 6948 Brodie Blvd
- 7062 Robertson Ct
- 7089 Robertson Ct
- 10008 Archer Ln
- 9879 Archer Ln