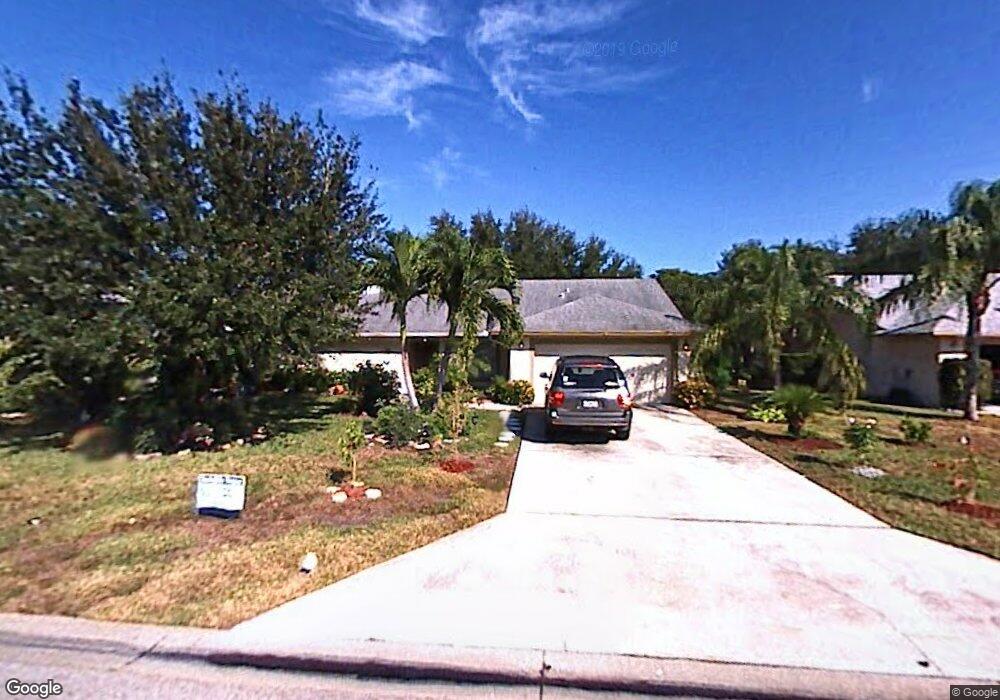
9943 Boca Ave N Unit 19 Naples, FL 34109
Estimated Value: $553,458 - $646,000
--
Bed
2
Baths
1,610
Sq Ft
$380/Sq Ft
Est. Value
About This Home
This home is located at 9943 Boca Ave N Unit 19, Naples, FL 34109 and is currently estimated at $612,365, approximately $380 per square foot. 9943 Boca Ave N Unit 19 is a home located in Collier County with nearby schools including Pelican Marsh Elementary School, North Naples Middle School, and Naples Christian Academy.
Ownership History
Date
Name
Owned For
Owner Type
Purchase Details
Closed on
Mar 31, 2016
Sold by
Naples Opportunity Fund Llc
Bought by
Fallon Ivette W and Fallon Michael
Current Estimated Value
Home Financials for this Owner
Home Financials are based on the most recent Mortgage that was taken out on this home.
Original Mortgage
$200,000
Outstanding Balance
$158,731
Interest Rate
3.65%
Mortgage Type
New Conventional
Estimated Equity
$453,634
Purchase Details
Closed on
Jan 14, 2016
Sold by
Finer Theresa M
Bought by
Naples Opportunity Fund Llc
Purchase Details
Closed on
Jan 1, 2016
Bought by
Fallon Ivette W and Fallon Michael
Purchase Details
Closed on
May 17, 2004
Sold by
Pavlick Andrew C and Pavlick Yvonne
Bought by
Finer Robert D and Finer Theresa M
Home Financials for this Owner
Home Financials are based on the most recent Mortgage that was taken out on this home.
Original Mortgage
$222,300
Interest Rate
8.5%
Mortgage Type
Purchase Money Mortgage
Create a Home Valuation Report for This Property
The Home Valuation Report is an in-depth analysis detailing your home's value as well as a comparison with similar homes in the area
Home Values in the Area
Average Home Value in this Area
Purchase History
| Date | Buyer | Sale Price | Title Company |
|---|---|---|---|
| Fallon Ivette W | $315,000 | Paradise Coast Title & Escro | |
| Naples Opportunity Fund Llc | -- | None Available | |
| Fallon Ivette W | $100 | -- | |
| Finer Robert D | $234,000 | Lawyers Title Ins |
Source: Public Records
Mortgage History
| Date | Status | Borrower | Loan Amount |
|---|---|---|---|
| Open | Fallon Ivette W | $200,000 | |
| Previous Owner | Finer Robert D | $222,300 |
Source: Public Records
Tax History Compared to Growth
Tax History
| Year | Tax Paid | Tax Assessment Tax Assessment Total Assessment is a certain percentage of the fair market value that is determined by local assessors to be the total taxable value of land and additions on the property. | Land | Improvement |
|---|---|---|---|---|
| 2025 | $4,560 | $458,025 | -- | -- |
| 2024 | $4,348 | $416,386 | -- | -- |
| 2023 | $4,348 | $378,533 | $0 | $0 |
| 2022 | $4,369 | $344,121 | $0 | $0 |
| 2021 | $3,688 | $312,837 | $0 | $0 |
| 2020 | $3,296 | $284,397 | $131,316 | $153,081 |
| 2019 | $3,180 | $272,061 | $129,084 | $142,977 |
| 2018 | $3,243 | $278,668 | $141,360 | $137,308 |
| 2017 | $3,336 | $285,437 | $148,800 | $136,637 |
| 2016 | $2,833 | $226,677 | $0 | $0 |
| 2015 | $2,727 | $206,070 | $0 | $0 |
| 2014 | $2,498 | $187,336 | $0 | $0 |
Source: Public Records
Map
Nearby Homes
- 9974 Boca Ave N
- 1930 Curling Ave
- 9874 Winterview Dr
- 9974 Winterview Dr
- 10094 Boca Cir
- 2335 Carrington Ct Unit 104
- 9741 Campbell Cir
- 2275 Harmony Ln Unit 103
- 9650 Victoria Ln Unit 201
- 1590 Winding Oaks Way Unit 103
- 1605 Winding Oaks Way Unit 103
- 9610 Victoria Ln Unit 306
- 9610 Victoria Ln Unit 208
- 9613 Crescent Garden Dr Unit F101
- 9798 Oxford St
- 3346 Erick Lake Dr Unit 2001
- 9943 Boca Ave N
- 9949 Boca Ave N
- 9937 Boca Ave N
- 10298 Boca Cir
- 10292 Boca Cir
- 9916 Boca Cir
- 9955 Boca Ave N
- 9932 Boca Cir
- 9944 Boca Ave N
- 10286 Boca Cir
- 9961 Boca Ave N
- 9950 Boca Ave N
- 10280 Boca Cir
- 9925 Boca Cir
- 9944 Boca Cir
- 9919 Boca Cir
- 9956 Boca Ave N
- 9931 Boca Cir
- 9913 Boca Cir
- 10303 Boca Cir