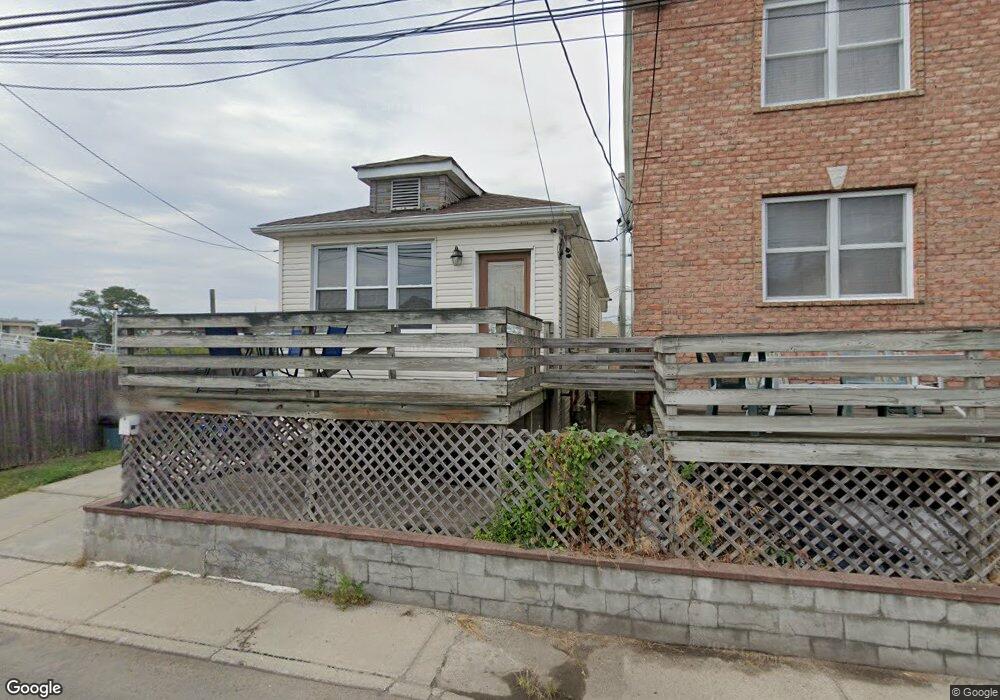
9945 Davenport Ct Howard Beach, NY 11414
Howard Beach NeighborhoodEstimated Value: $423,000 - $573,262
--
Bed
--
Bath
1,280
Sq Ft
$398/Sq Ft
Est. Value
About This Home
This home is located at 9945 Davenport Ct, Howard Beach, NY 11414 and is currently estimated at $508,816, approximately $397 per square foot. 9945 Davenport Ct is a home located in Queens County with nearby schools including P.S./M.S. 146 Howard Beach, Robert H. Goddard High School, and John Adams High School.
Ownership History
Date
Name
Owned For
Owner Type
Purchase Details
Closed on
May 18, 2020
Sold by
Bravo Margarita L and Caspare Michael
Bought by
Cierzniewski Bruce
Current Estimated Value
Purchase Details
Closed on
Jun 11, 2001
Sold by
Caspare Michael
Bought by
Caspare Michael and Bravo Margarita L
Home Financials for this Owner
Home Financials are based on the most recent Mortgage that was taken out on this home.
Original Mortgage
$120,000
Interest Rate
7.21%
Mortgage Type
Purchase Money Mortgage
Purchase Details
Closed on
Jan 20, 2000
Sold by
Eck Bernard J
Bought by
Caspare Michael
Home Financials for this Owner
Home Financials are based on the most recent Mortgage that was taken out on this home.
Original Mortgage
$86,400
Interest Rate
7.98%
Create a Home Valuation Report for This Property
The Home Valuation Report is an in-depth analysis detailing your home's value as well as a comparison with similar homes in the area
Home Values in the Area
Average Home Value in this Area
Purchase History
| Date | Buyer | Sale Price | Title Company |
|---|---|---|---|
| Cierzniewski Bruce | $374,000 | -- | |
| Cierzniewski Bruce | $374,000 | -- | |
| Caspare Michael | -- | -- | |
| Caspare Michael | -- | -- | |
| Caspare Michael | $108,000 | -- | |
| Caspare Michael | $108,000 | -- |
Source: Public Records
Mortgage History
| Date | Status | Borrower | Loan Amount |
|---|---|---|---|
| Previous Owner | Caspare Michael | $120,000 | |
| Previous Owner | Caspare Michael | $86,400 |
Source: Public Records
Tax History Compared to Growth
Tax History
| Year | Tax Paid | Tax Assessment Tax Assessment Total Assessment is a certain percentage of the fair market value that is determined by local assessors to be the total taxable value of land and additions on the property. | Land | Improvement |
|---|---|---|---|---|
| 2025 | $2,029 | $10,568 | $1,633 | $8,935 |
| 2024 | $2,029 | $10,102 | $1,475 | $8,627 |
| 2023 | $1,943 | $9,672 | $1,554 | $8,118 |
| 2022 | $1,845 | $26,460 | $5,100 | $21,360 |
| 2021 | $1,855 | $25,020 | $5,100 | $19,920 |
| 2020 | $1,864 | $27,480 | $5,100 | $22,380 |
| 2019 | $1,761 | $23,520 | $5,100 | $18,420 |
| 2018 | $1,643 | $8,060 | $2,307 | $5,753 |
| 2017 | $1,570 | $7,701 | $1,948 | $5,753 |
| 2016 | $1,468 | $7,701 | $1,948 | $5,753 |
| 2015 | $657 | $7,339 | $2,874 | $4,465 |
| 2014 | $657 | $7,015 | $2,747 | $4,268 |
Source: Public Records
Map
Nearby Homes
- 99-48 1st St
- 99-61 163rd Rd
- 99-71 163rd Rd
- 99-77 163rd Rd
- 102-03 Rau Ct
- Davenport Court Davenport Ct
- 16309 99th St
- 102-27 163rd Dr
- 163-24 99th St
- 16221 102nd St
- 9934 164th Ave
- 10215 Dunton Ct
- 1st Street Howard Beach
- Block 14238, Lot 115 1st St
- 16209 99th St
- 162-09 99th St
- 102-25 163rd Dr
- 102-31 Russell St
- 9957 164th Rd
- 143 Broadway
- 99-45 Davenport Ct
- 9947 Davenport Ct
- 9948 Davenport Ct
- 9942 Rau Ct
- 9939 Davenport Ct
- 9952 Rau Ct
- 9950 Davenport Ct
- 9938 Rau Ct
- 9956 Rau Ct
- 9936 Davenport Ct
- 4 Davenport Ct
- 9958 Davenport Ct
- 9958 Rau Ct
- 102-48 First Ave
- 9946 1st St
- 99-48 Davenport Ct
- 0 Davenport Ct Unit 3061802
- 0 Davenport Ct Unit 3019374
- 0 Davenport Ct Unit 2972435
- 0 Davenport Ct Unit P1295990