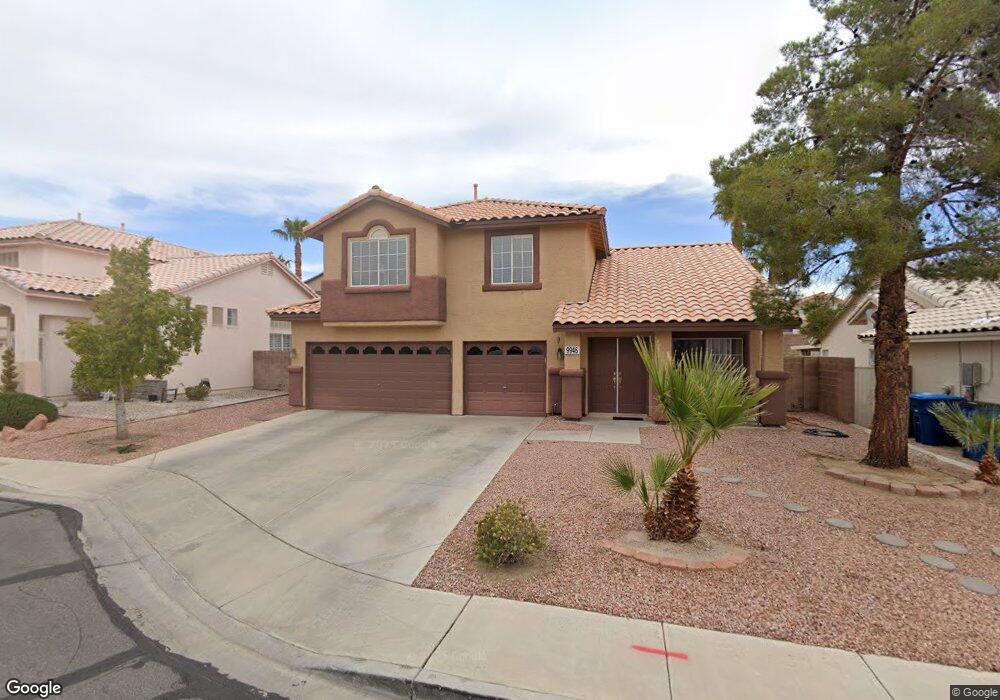
9946 Masked Duck Ave Las Vegas, NV 89117
Rancho Viejo NeighborhoodEstimated Value: $513,806 - $614,000
4
Beds
3
Baths
2,106
Sq Ft
$272/Sq Ft
Est. Value
About This Home
This home is located at 9946 Masked Duck Ave, Las Vegas, NV 89117 and is currently estimated at $572,202, approximately $271 per square foot. 9946 Masked Duck Ave is a home located in Clark County with nearby schools including Keith C. & Karen W. Hayes Elementary School, Victoria Fertitta Middle School, and Spring Valley High School.
Ownership History
Date
Name
Owned For
Owner Type
Purchase Details
Closed on
Mar 19, 2013
Sold by
Eschbach George and Eschbach Tanarat
Bought by
Eschbach George and Eschbach Tanarat
Current Estimated Value
Home Financials for this Owner
Home Financials are based on the most recent Mortgage that was taken out on this home.
Original Mortgage
$116,645
Outstanding Balance
$24,485
Interest Rate
3.92%
Mortgage Type
New Conventional
Estimated Equity
$547,717
Purchase Details
Closed on
Aug 6, 2003
Sold by
Eschbach George
Bought by
Eschbach George and Eschbach Tamarat
Home Financials for this Owner
Home Financials are based on the most recent Mortgage that was taken out on this home.
Original Mortgage
$137,000
Interest Rate
5.17%
Mortgage Type
Unknown
Purchase Details
Closed on
Jun 6, 1995
Sold by
Eschbach Tanarat
Bought by
Eschbach George
Home Financials for this Owner
Home Financials are based on the most recent Mortgage that was taken out on this home.
Original Mortgage
$153,000
Interest Rate
7.62%
Create a Home Valuation Report for This Property
The Home Valuation Report is an in-depth analysis detailing your home's value as well as a comparison with similar homes in the area
Home Values in the Area
Average Home Value in this Area
Purchase History
| Date | Buyer | Sale Price | Title Company |
|---|---|---|---|
| Eschbach George | -- | None Available | |
| Eschbach George | $137,000 | Nevada Title Company | |
| Eschbach George | -- | Old Republic Title Company | |
| Eschbach George | $162,000 | Old Republic Title Company |
Source: Public Records
Mortgage History
| Date | Status | Borrower | Loan Amount |
|---|---|---|---|
| Open | Eschbach George | $116,645 | |
| Closed | Eschbach George | $137,000 | |
| Previous Owner | Eschbach George | $153,000 |
Source: Public Records
Tax History Compared to Growth
Tax History
| Year | Tax Paid | Tax Assessment Tax Assessment Total Assessment is a certain percentage of the fair market value that is determined by local assessors to be the total taxable value of land and additions on the property. | Land | Improvement |
|---|---|---|---|---|
| 2025 | $2,214 | $116,660 | $51,450 | $65,210 |
| 2024 | $2,151 | $116,660 | $51,450 | $65,210 |
| 2023 | $1,755 | $107,680 | $45,500 | $62,180 |
| 2022 | $2,088 | $91,216 | $34,300 | $56,916 |
| 2021 | $2,027 | $86,538 | $32,200 | $54,338 |
| 2020 | $1,965 | $85,158 | $31,150 | $54,008 |
| 2019 | $1,908 | $80,345 | $26,950 | $53,395 |
| 2018 | $1,852 | $74,661 | $23,450 | $51,211 |
| 2017 | $2,131 | $72,659 | $20,650 | $52,009 |
| 2016 | $1,755 | $70,455 | $18,200 | $52,255 |
| 2015 | $1,751 | $57,912 | $15,050 | $42,862 |
| 2014 | $1,699 | $58,820 | $13,650 | $45,170 |
Source: Public Records
Map
Nearby Homes
- 9931 Sparrow Ridge Ave
- 9888 Sparrow Ridge Ave
- 9857 Pioneer Ave
- 9741 Horizon Hills Dr
- 10068 Yellow Canary Ave
- 9905 Fox Springs Dr
- 9820 Cross Creek Way
- 9785 Turtle Head Ct
- 9836 Russett Wood Cir
- 9833 Dardanelle Ct
- 9917 Aspen Knoll Ct
- 9750 Pine Thickett Ave
- 3381 Biscayne Bay Dr
- 9651 Stoney Creek Dr
- 9677 Casper Peak Ct
- 10024 Rolling Glen Ct
- 3213 Shallow Point Cir
- 9993 Lemon Valley Ave
- 10267 Early Morning Ave
- 3580 Teton Hills St
- 9936 Masked Duck Ave
- 9956 Masked Duck Ave
- 9935 Pioneer Ave
- 9941 Pioneer Ave
- 9929 Pioneer Ave
- 9947 Pioneer Ave
- 9926 Masked Duck Ave
- 9923 Pioneer Ave
- 9945 Masked Duck Ave
- 9955 Masked Duck Ave
- 9960 Prairie Dove Ave
- 3440 Green Finch St
- 9955 Yellow Canary Ave
- 9935 Masked Duck Ave
- 9911 Pioneer Ave
- 9963 Yellow Canary Ave
- 9927 Masked Duck Ave
- 9927 Masked Duck Ave Unit n/a
- 3450 Green Finch St
- 9971 Yellow Canary Ave Unit SFR