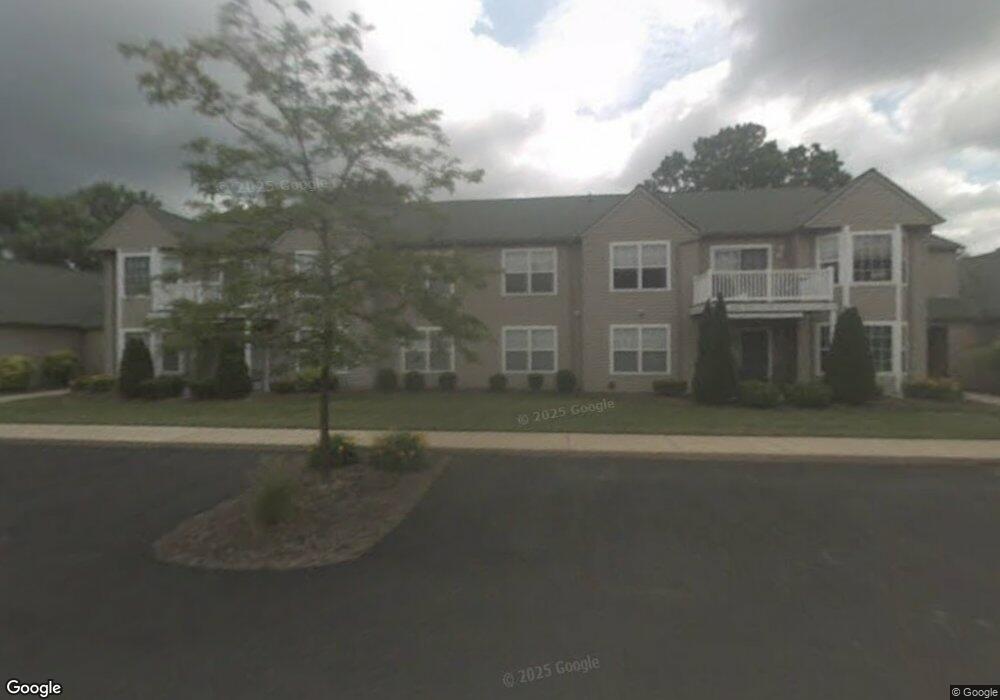
995 Canyon View Rd Unit 995F Northfield, OH 44067
Estimated Value: $173,000 - $201,000
2
Beds
2
Baths
1,060
Sq Ft
$176/Sq Ft
Est. Value
About This Home
This home is located at 995 Canyon View Rd Unit 995F, Northfield, OH 44067 and is currently estimated at $186,699, approximately $176 per square foot. 995 Canyon View Rd Unit 995F is a home located in Summit County with nearby schools including Lee Eaton Elementary School, Nordonia Middle School, and Nordonia High School.
Ownership History
Date
Name
Owned For
Owner Type
Purchase Details
Closed on
May 30, 2023
Sold by
Korfant Joan Valerie
Bought by
Christensen Colleen M and Christensen John M
Current Estimated Value
Purchase Details
Closed on
Sep 18, 2003
Sold by
Henderson David A and Henderson Amy A
Bought by
Korfant Richard J and Korfant Joan
Home Financials for this Owner
Home Financials are based on the most recent Mortgage that was taken out on this home.
Original Mortgage
$100,800
Interest Rate
6.33%
Mortgage Type
Purchase Money Mortgage
Purchase Details
Closed on
Nov 16, 1998
Sold by
Greenwood Trading Corp
Bought by
Henderson David
Home Financials for this Owner
Home Financials are based on the most recent Mortgage that was taken out on this home.
Original Mortgage
$95,200
Interest Rate
6.59%
Create a Home Valuation Report for This Property
The Home Valuation Report is an in-depth analysis detailing your home's value as well as a comparison with similar homes in the area
Home Values in the Area
Average Home Value in this Area
Purchase History
| Date | Buyer | Sale Price | Title Company |
|---|---|---|---|
| Christensen Colleen M | $155,000 | None Listed On Document | |
| Korfant Richard J | $126,000 | Real Living Title Agency Ltd | |
| Henderson David | $115,000 | -- |
Source: Public Records
Mortgage History
| Date | Status | Borrower | Loan Amount |
|---|---|---|---|
| Previous Owner | Korfant Richard J | $100,800 | |
| Previous Owner | Henderson David | $95,200 | |
| Closed | Korfant Richard J | $25,000 |
Source: Public Records
Tax History Compared to Growth
Tax History
| Year | Tax Paid | Tax Assessment Tax Assessment Total Assessment is a certain percentage of the fair market value that is determined by local assessors to be the total taxable value of land and additions on the property. | Land | Improvement |
|---|---|---|---|---|
| 2025 | $1,916 | $46,470 | $5,632 | $40,838 |
| 2024 | $1,916 | $46,470 | $5,632 | $40,838 |
| 2023 | $1,916 | $46,470 | $5,632 | $40,838 |
| 2022 | $1,711 | $35,652 | $4,267 | $31,385 |
| 2021 | $1,677 | $35,652 | $4,267 | $31,385 |
| 2020 | $1,650 | $35,660 | $4,270 | $31,390 |
| 2019 | $1,415 | $29,370 | $4,230 | $25,140 |
| 2018 | $1,251 | $29,370 | $4,230 | $25,140 |
| 2017 | $1,287 | $29,370 | $4,230 | $25,140 |
| 2016 | $1,287 | $29,370 | $4,230 | $25,140 |
| 2015 | $1,287 | $29,370 | $4,230 | $25,140 |
| 2014 | $1,279 | $29,370 | $4,230 | $25,140 |
| 2013 | $1,656 | $35,970 | $4,230 | $31,740 |
Source: Public Records
Map
Nearby Homes
- 1115 Canyon View Rd Unit 504
- 1105 Canyon View Rd Unit 305
- 1105 Canyon View Rd Unit 106
- 6270 Greenwood Pkwy Unit 402
- 6280 Greenwood Pkwy Unit 202
- 6290 Greenwood Pkwy Unit 302
- 6320 Greenwood Pkwy Unit 100-4
- 6330 Greenwood Pkwy Unit 103
- 6340 Greenwood Pkwy Unit 405
- 935 Canyon View Rd
- 938 Trimble Place Unit 3002H
- 842 Arboretum Cir
- 804 Arboretum Cir Unit 804
- 874 Hemlock Ln
- 796 Pipes Ct Unit 1604
- 7470 Millrace Ln
- 628 Windsor Ln
- 8134 N Boyden Rd
- 8094 Rolling Brook Rd
- 125 Old North Rd
- 995 Canyon View Rd Unit B
- 995 Canyon View Rd Unit 995G
- 995 Canyon View Rd Unit 995E
- 995 Canyon View Rd Unit 995D
- 995 Canyon View Rd Unit 995C
- 995 Canyon View Rd Unit 995B
- 995 Canyon View Rd Unit 995A
- 995 Canyon View Rd Unit 995H
- 995 Canyon View Rd Unit H
- 995 Canyon View Rd Unit A
- 995 Canyon View Rd Unit C
- 995 Canyon View Rd Unit E
- 995 Canyon View Rd Unit G
- 995 Canyon View Rd Unit D
- 995 Canyon View Rd Unit F
- 995 Canyon View Rd
- 1005 Canyon View Rd Unit 1005G
- 1005 Canyon View Rd Unit 1005E
- 1005 Canyon View Rd Unit 1005D
- 1005 Canyon View Rd Unit 1005C