Estimated Value: $483,000 - $520,000
3
Beds
2
Baths
2,146
Sq Ft
$233/Sq Ft
Est. Value
About This Home
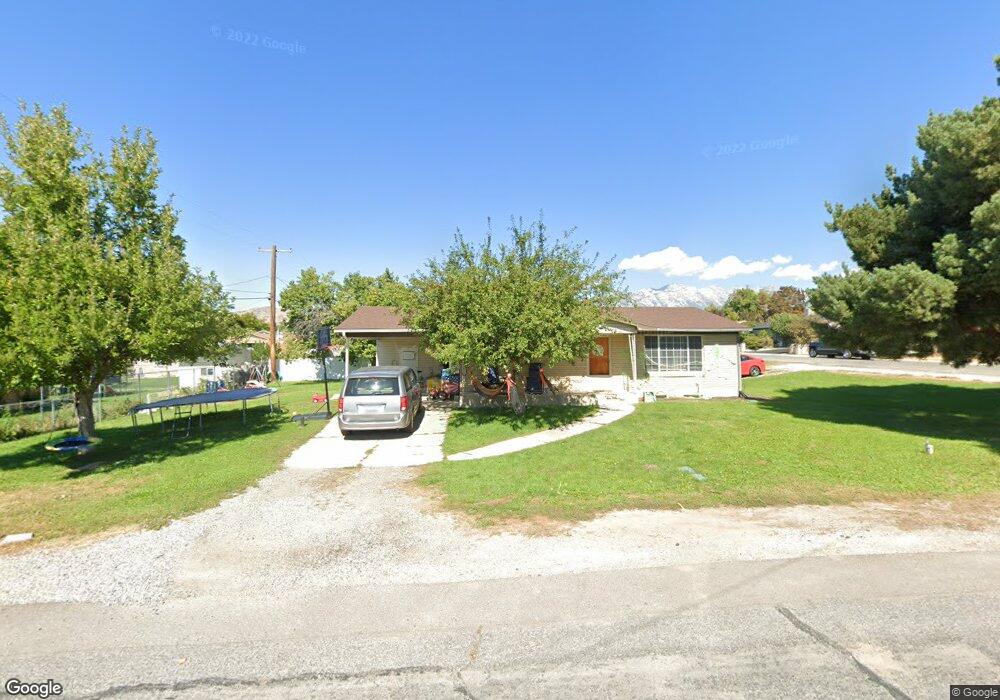
This home is located at 995 E 760 N, Lehi, UT 84043 and is currently estimated at $499,589, approximately $232 per square foot. 995 E 760 N is a home located in Utah County with nearby schools including Sego Lily Elementary School, Lehi Junior High School, and Skyridge High School.
Ownership History
Date
Name
Owned For
Owner Type
Purchase Details
Closed on
Sep 20, 2023
Sold by
Daniel And Nicole Crawley Living Trust
Bought by
Maat Family Trust and Maat
Current Estimated Value
Purchase Details
Closed on
May 10, 2016
Sold by
Crawley Daniel Owen
Bought by
Crawley Daniel Owen and Crawley Nicole H
Purchase Details
Closed on
Sep 1, 2015
Sold by
Bergquist Gordon R and Bergquist Kathryn J
Bought by
Crawley Daniel
Home Financials for this Owner
Home Financials are based on the most recent Mortgage that was taken out on this home.
Original Mortgage
$140,625
Interest Rate
3.86%
Mortgage Type
New Conventional
Purchase Details
Closed on
Apr 15, 2004
Sold by
Bergquist Gordon R
Bought by
Bergquist Gordon R and Bergquist Kathryn J
Purchase Details
Closed on
Nov 18, 2003
Sold by
Bergquist Gordon R
Bought by
Bergquist Gordon R and Bergquist Kathryn J
Create a Home Valuation Report for This Property
The Home Valuation Report is an in-depth analysis detailing your home's value as well as a comparison with similar homes in the area
Home Values in the Area
Average Home Value in this Area
Purchase History
We collect this data history from publicly available records. To have your information removed, we recommend requesting removal directly through your county’s website.
| Date | Buyer | Sale Price | Title Company |
|---|---|---|---|
| Maat Family Trust | -- | Real Title Mountain West | |
| Crawley Daniel Owen | -- | None Available | |
| Crawley Daniel | -- | Sutherland Title Co | |
| Bergquist Gordon R | -- | -- | |
| Bergquist Gordon R | -- | -- |
Source: Public Records
Mortgage History
We collect this data history from publicly available records. To have your information removed, we recommend requesting removal directly through your county’s website.
| Date | Status | Borrower | Loan Amount |
|---|---|---|---|
| Previous Owner | Crawley Daniel | $140,625 |
Source: Public Records
Tax History
| Year | Tax Paid | Tax Assessment Tax Assessment Total Assessment is a certain percentage of the fair market value that is determined by local assessors to be the total taxable value of land and additions on the property. | Land | Improvement |
|---|---|---|---|---|
| 2025 | $3,715 | $454,800 | $201,200 | $253,600 |
| 2024 | $3,715 | $434,700 | $0 | $0 |
| 2023 | $3,545 | $450,500 | $0 | $0 |
| 2022 | $3,543 | $436,400 | $186,200 | $250,200 |
| 2021 | $1,720 | $320,300 | $116,400 | $203,900 |
| 2020 | $1,621 | $298,400 | $107,800 | $190,600 |
| 2019 | $1,429 | $273,500 | $107,800 | $165,700 |
| 2018 | $1,380 | $249,700 | $96,700 | $153,000 |
| 2017 | $1,240 | $119,295 | $0 | $0 |
| 2016 | $1,213 | $108,240 | $0 | $0 |
| 2015 | $1,170 | $99,110 | $0 | $0 |
| 2014 | $1,136 | $95,645 | $0 | $0 |
Source: Public Records
Map
Nearby Homes
- 1175 E 900 N
- 890 N Whipple Dr
- 524 N 900 E
- 889 E 500 N
- 418 N 1100 E Unit 1
- 556 N 1440 E
- 344 N 1100 E Unit G1
- 1272 N Cedar Hollow Blvd
- 893 N 1580 E
- 595 E 900 N
- 1396 E 380 N
- 312 N 720 E
- 595 S 600 E
- 1433 N 1250 E
- 1785 E 900 N
- 965 N 400 E
- 335 E 500 N
- 965 N 860 W
- 3959 W 1000 N Unit 440
- 3995 W 1000 N Unit 443
Your Personal Tour Guide
Ask me questions while you tour the home.