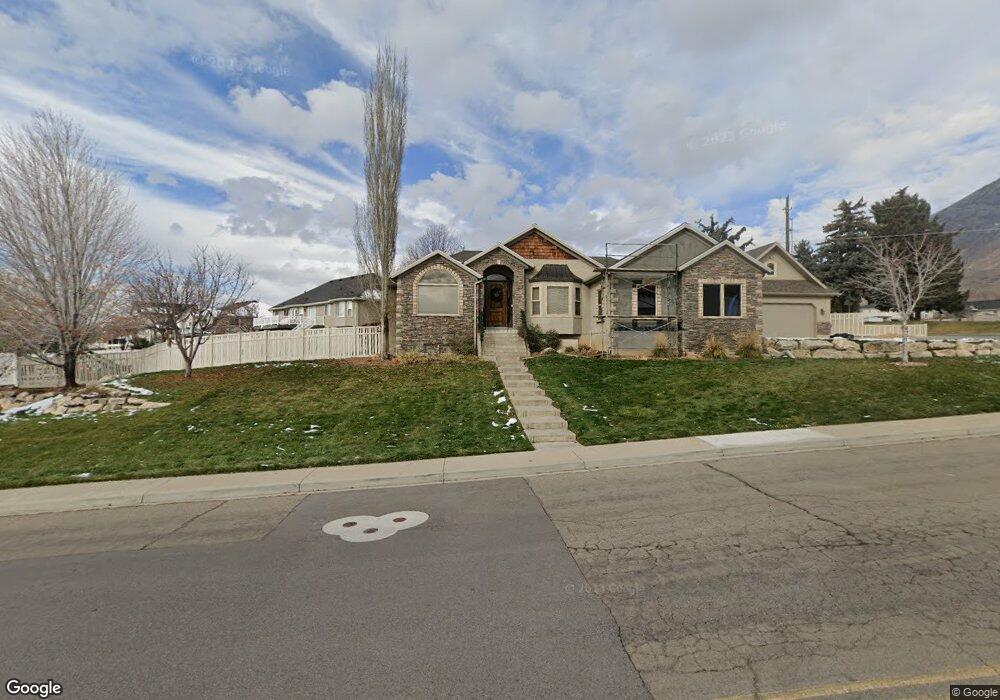
995 E Center St Pleasant Grove, UT 84062
Estimated Value: $881,000 - $1,045,000
7
Beds
5
Baths
4,781
Sq Ft
$200/Sq Ft
Est. Value
About This Home
This home is located at 995 E Center St, Pleasant Grove, UT 84062 and is currently estimated at $956,611, approximately $200 per square foot. 995 E Center St is a home located in Utah County with nearby schools including Grovecrest Elementary School, Pleasant Grove Junior High School, and Pleasant Grove High School.
Ownership History
Date
Name
Owned For
Owner Type
Purchase Details
Closed on
Aug 3, 2020
Sold by
Armstrong John Andrew and Armstrong Jamie L
Bought by
Larson Aaron and Larson Rachel
Current Estimated Value
Home Financials for this Owner
Home Financials are based on the most recent Mortgage that was taken out on this home.
Original Mortgage
$440,000
Outstanding Balance
$391,032
Interest Rate
3.1%
Mortgage Type
New Conventional
Estimated Equity
$565,579
Purchase Details
Closed on
Mar 6, 2015
Sold by
Armstrong John Andrew
Bought by
Armstrong John Andrew and Armstrong Jamie L
Home Financials for this Owner
Home Financials are based on the most recent Mortgage that was taken out on this home.
Original Mortgage
$385,458
Interest Rate
3.61%
Mortgage Type
New Conventional
Purchase Details
Closed on
Apr 2, 2009
Sold by
Armstrong John Andrew and Armstrong Corinn D
Bought by
Armstrong John Andrew
Home Financials for this Owner
Home Financials are based on the most recent Mortgage that was taken out on this home.
Original Mortgage
$417,000
Interest Rate
5.04%
Mortgage Type
New Conventional
Purchase Details
Closed on
Feb 28, 2003
Sold by
Armstrong Corinn
Bought by
Armstrong John Andrew and Armstrong Corinn D
Home Financials for this Owner
Home Financials are based on the most recent Mortgage that was taken out on this home.
Original Mortgage
$24,292
Interest Rate
5.85%
Mortgage Type
Credit Line Revolving
Purchase Details
Closed on
Feb 1, 2002
Sold by
Gunter John L and Gunter Michelle Renee
Bought by
Armstrong Corinn
Purchase Details
Closed on
Jun 14, 2000
Sold by
Goodrich Stan and Merrill Michael
Bought by
Gunter Ii John L and Gunter Michelle Renee
Home Financials for this Owner
Home Financials are based on the most recent Mortgage that was taken out on this home.
Original Mortgage
$240,000
Interest Rate
8.27%
Mortgage Type
Seller Take Back
Purchase Details
Closed on
Jan 7, 2000
Sold by
Paramount Home Inc
Bought by
Goodrich Stan and Merrill Michael
Create a Home Valuation Report for This Property
The Home Valuation Report is an in-depth analysis detailing your home's value as well as a comparison with similar homes in the area
Home Values in the Area
Average Home Value in this Area
Purchase History
We collect this data history from publicly available records. To have your information removed, we recommend requesting removal directly through your county’s website.
| Date | Buyer | Sale Price | Title Company |
|---|---|---|---|
| Larson Aaron | -- | Vanguard Title Ins Agency Ll | |
| Armstrong John Andrew | -- | Inwest Title | |
| Armstrong John Andrew | -- | Inwest Title Services Inc | |
| Armstrong John Andrew | -- | Sundance Title Insurance Ag | |
| Armstrong Corinn | -- | Sundance Title Ins Agency | |
| Gunter Ii John L | -- | Old Republic Title Company | |
| Goodrich Stan | -- | Title West Title Co |
Source: Public Records
Mortgage History
We collect this data history from publicly available records. To have your information removed, we recommend requesting removal directly through your county’s website.
| Date | Status | Borrower | Loan Amount |
|---|---|---|---|
| Open | Larson Aaron | $440,000 | |
| Previous Owner | Armstrong John Andrew | $385,458 | |
| Previous Owner | Armstrong John Andrew | $417,000 | |
| Previous Owner | Armstrong John Andrew | $24,292 | |
| Previous Owner | Gunter Ii John L | $240,000 |
Source: Public Records
Tax History
| Year | Tax Paid | Tax Assessment Tax Assessment Total Assessment is a certain percentage of the fair market value that is determined by local assessors to be the total taxable value of land and additions on the property. | Land | Improvement |
|---|---|---|---|---|
| 2025 | $3,440 | $467,445 | -- | -- |
| 2024 | $3,440 | $410,630 | $0 | $0 |
| 2023 | $3,376 | $412,445 | $0 | $0 |
| 2022 | $3,829 | $465,465 | $0 | $0 |
| 2021 | $3,397 | $628,800 | $196,800 | $432,000 |
| 2020 | $3,293 | $597,600 | $182,200 | $415,400 |
| 2019 | $2,850 | $534,900 | $173,700 | $361,200 |
| 2018 | $2,741 | $486,300 | $156,800 | $329,500 |
| 2017 | $2,748 | $259,545 | $0 | $0 |
| 2016 | $2,846 | $259,545 | $0 | $0 |
| 2015 | $2,671 | $230,670 | $0 | $0 |
| 2014 | $2,696 | $230,670 | $0 | $0 |
Source: Public Records
Map
Nearby Homes
Your Personal Tour Guide
Ask me questions while you tour the home.