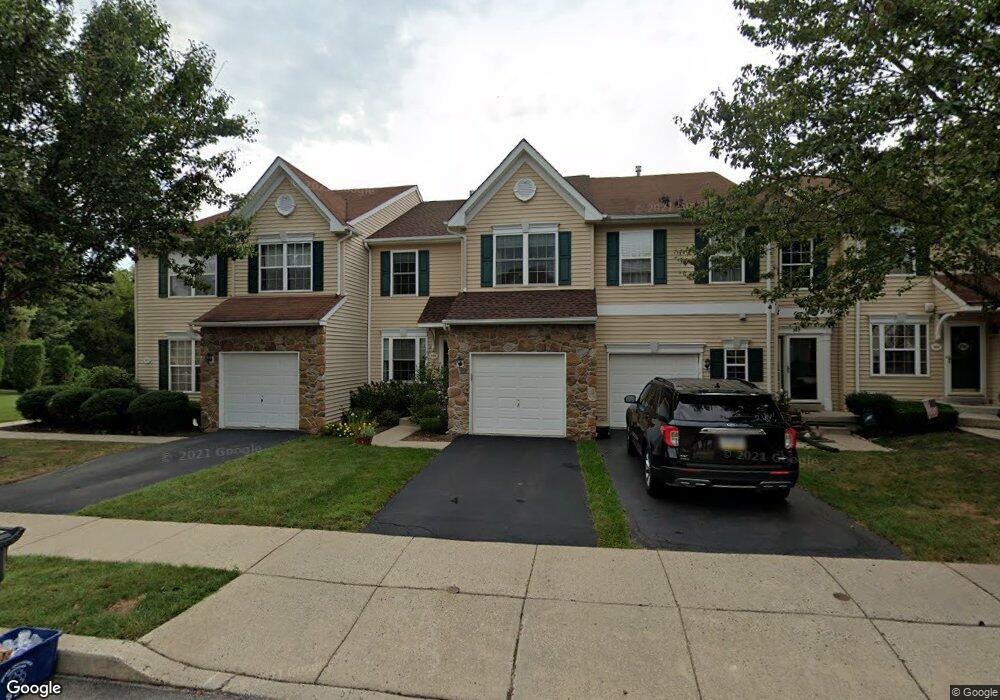
995 Katie Cir Royersford, PA 19468
Estimated Value: $436,000 - $453,642
3
Beds
3
Baths
1,785
Sq Ft
$250/Sq Ft
Est. Value
About This Home
This home is located at 995 Katie Cir, Royersford, PA 19468 and is currently estimated at $445,911, approximately $249 per square foot. 995 Katie Cir is a home located in Montgomery County with nearby schools including Royersford Elementary School, Spring-Ford Middle School 5/6/7 Grade Center, and Spring-Ford Middle School 8th Grade Center.
Ownership History
Date
Name
Owned For
Owner Type
Purchase Details
Closed on
Jun 23, 2010
Sold by
Veigel Ralph and Michel Kimberely
Bought by
Gambone Denise M and Gambone Anthony
Current Estimated Value
Home Financials for this Owner
Home Financials are based on the most recent Mortgage that was taken out on this home.
Original Mortgage
$204,000
Outstanding Balance
$135,440
Interest Rate
4.78%
Estimated Equity
$310,471
Purchase Details
Closed on
Jul 25, 2007
Sold by
Potteiger Gregory T and Potteiger Karen
Bought by
Michel Kimberely and Veigel Ralph
Home Financials for this Owner
Home Financials are based on the most recent Mortgage that was taken out on this home.
Original Mortgage
$191,250
Interest Rate
6.72%
Purchase Details
Closed on
Sep 2, 2005
Sold by
Potteiger Gregory T and Dinenna Karen
Bought by
Potteiger Gregory T and Potteiger Karen
Purchase Details
Closed on
Dec 27, 2000
Sold by
Sukonik Indian Creek Corp
Bought by
Potteiger Gregory T and Dinenna Karen
Create a Home Valuation Report for This Property
The Home Valuation Report is an in-depth analysis detailing your home's value as well as a comparison with similar homes in the area
Home Values in the Area
Average Home Value in this Area
Purchase History
| Date | Buyer | Sale Price | Title Company |
|---|---|---|---|
| Gambone Denise M | $255,000 | None Available | |
| Michel Kimberely | $255,000 | None Available | |
| Potteiger Gregory T | -- | -- | |
| Potteiger Gregory T | $165,190 | -- |
Source: Public Records
Mortgage History
| Date | Status | Borrower | Loan Amount |
|---|---|---|---|
| Open | Gambone Denise M | $204,000 | |
| Previous Owner | Michel Kimberely | $191,250 |
Source: Public Records
Tax History Compared to Growth
Tax History
| Year | Tax Paid | Tax Assessment Tax Assessment Total Assessment is a certain percentage of the fair market value that is determined by local assessors to be the total taxable value of land and additions on the property. | Land | Improvement |
|---|---|---|---|---|
| 2025 | $5,155 | $133,740 | $14,120 | $119,620 |
| 2024 | $5,155 | $133,740 | $14,120 | $119,620 |
| 2023 | $4,921 | $133,740 | $14,120 | $119,620 |
| 2022 | $4,755 | $133,740 | $14,120 | $119,620 |
| 2021 | $4,468 | $133,740 | $14,120 | $119,620 |
| 2020 | $4,350 | $133,740 | $14,120 | $119,620 |
| 2019 | $4,268 | $133,740 | $14,120 | $119,620 |
| 2018 | $3,391 | $133,740 | $14,120 | $119,620 |
| 2017 | $4,185 | $133,740 | $14,120 | $119,620 |
| 2016 | $4,133 | $133,740 | $14,120 | $119,620 |
| 2015 | $3,865 | $133,740 | $14,120 | $119,620 |
| 2014 | $3,865 | $133,740 | $14,120 | $119,620 |
Source: Public Records
Map
Nearby Homes
- 47 Orchard Ct
- 184 Providence Forge Rd
- 96 Providence Forge Rd
- 149 Roboda Blvd
- Granton Plan at Lewis Pointe
- 107 Beacon Ct Unit 10104
- 103 Beacon Ct Unit 10102
- 104 Beacon Ct Unit 10403
- 36 Roboda Blvd
- 123 Beacon Ct Unit 10205
- 19 Iroquois Dr
- 604 Green St
- 484 Fruit Farm Rd
- 209 Old State Rd
- 335 Arch St
- 518 Walnut St
- 0 Main St Unit PAMC2088436
- 414 2nd Ave
- 545 N Lewis Rd
- 6 Dorothy Cir