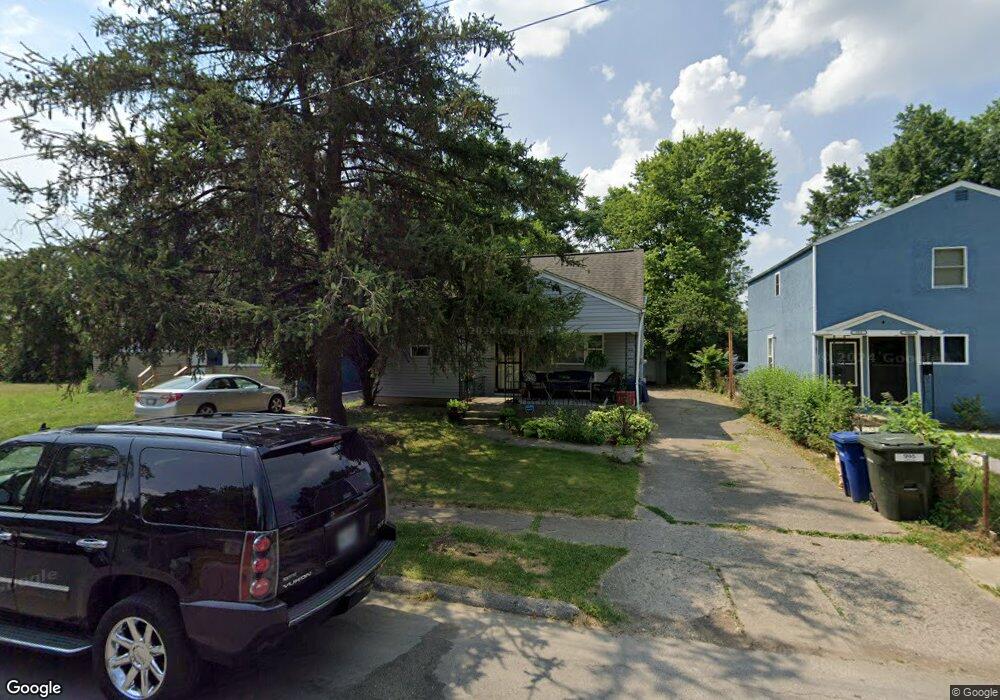
995 Loretta Ave Columbus, OH 43211
North Linden NeighborhoodEstimated Value: $117,000 - $168,000
4
Beds
1
Bath
1,208
Sq Ft
$126/Sq Ft
Est. Value
About This Home
This home is located at 995 Loretta Ave, Columbus, OH 43211 and is currently estimated at $152,392, approximately $126 per square foot. 995 Loretta Ave is a home located in Franklin County with nearby schools including Linden-Mckinley Stem School On Arcadia, North Columbus Preparatory Academy, and Focus Learning Academy of Central Columbus.
Ownership History
Date
Name
Owned For
Owner Type
Purchase Details
Closed on
May 3, 2017
Sold by
Rogers Rodney D and Rogers Lanese T
Bought by
Morgan Rhonda Jean
Current Estimated Value
Home Financials for this Owner
Home Financials are based on the most recent Mortgage that was taken out on this home.
Original Mortgage
$56,216
Outstanding Balance
$47,137
Interest Rate
4.75%
Mortgage Type
FHA
Estimated Equity
$105,255
Purchase Details
Closed on
Mar 30, 2005
Sold by
Rogers Jeanette
Bought by
Rogers Rodney D and Rogers Lanese T
Home Financials for this Owner
Home Financials are based on the most recent Mortgage that was taken out on this home.
Original Mortgage
$61,750
Interest Rate
5.64%
Mortgage Type
New Conventional
Purchase Details
Closed on
Jun 15, 1984
Bought by
Rogers Jeanette
Create a Home Valuation Report for This Property
The Home Valuation Report is an in-depth analysis detailing your home's value as well as a comparison with similar homes in the area
Home Values in the Area
Average Home Value in this Area
Purchase History
| Date | Buyer | Sale Price | Title Company |
|---|---|---|---|
| Morgan Rhonda Jean | $65,000 | Bexley Title Box | |
| Rogers Rodney D | $65,000 | Bexley Titl | |
| Rogers Jeanette | -- | -- |
Source: Public Records
Mortgage History
| Date | Status | Borrower | Loan Amount |
|---|---|---|---|
| Open | Morgan Rhonda Jean | $56,216 | |
| Closed | Rogers Rodney D | $61,750 |
Source: Public Records
Tax History
| Year | Tax Paid | Tax Assessment Tax Assessment Total Assessment is a certain percentage of the fair market value that is determined by local assessors to be the total taxable value of land and additions on the property. | Land | Improvement |
|---|---|---|---|---|
| 2025 | $2,176 | $48,480 | $11,060 | $37,420 |
| 2024 | $2,176 | $48,480 | $11,060 | $37,420 |
| 2023 | $2,148 | $48,475 | $11,060 | $37,415 |
| 2022 | $1,149 | $22,160 | $6,830 | $15,330 |
| 2021 | $1,151 | $22,160 | $6,830 | $15,330 |
| 2020 | $1,153 | $22,160 | $6,830 | $15,330 |
| 2019 | $1,094 | $18,030 | $5,950 | $12,080 |
| 2018 | $1,128 | $18,030 | $5,950 | $12,080 |
| 2017 | $1,093 | $18,030 | $5,950 | $12,080 |
| 2016 | $1,282 | $19,360 | $3,500 | $15,860 |
| 2015 | $1,164 | $19,360 | $3,500 | $15,860 |
| 2014 | $1,167 | $19,360 | $3,500 | $15,860 |
| 2013 | $678 | $22,785 | $4,130 | $18,655 |
Source: Public Records
Map
Nearby Homes
- 954 E Hudson St
- 2459 Atwood Terrace
- 2362 McGuffey Rd
- 2311 McGuffey Rd
- 2445-2447 Hiawatha St
- 2488 McGuffey Rd
- 2352 Hiawatha Park Dr
- 1143 Loretta Ave
- 2595 Grasmere Ave
- 2593 Atwood Terrace
- 2332 Hamilton Ave
- 2243-2245 Lexington Ave
- 2610 Atwood Terrace
- 1204 Loretta Ave
- 2532 Renwood Place
- 2295 Velma Ave
- 2560 Osceola Ave
- 2205 Atwood Terrace
- 2574 Renwood Place
- 2173 Lexington Ave
- 987 Loretta Ave Unit 989
- 1001 Loretta Ave
- 981 Loretta Ave Unit 983
- 1007 Loretta Ave
- 1000 E Hudson St
- 1011 Loretta Ave
- 1000 Loretta Ave
- 992 Loretta Ave
- 972 E Hudson St
- 1019 Loretta Ave
- 1006 Loretta Ave
- 969 Loretta Ave
- 1014 Loretta Ave
- 2462 Howey Rd
- 1027 Loretta Ave
- 1020 Loretta Ave
- 985 E Hudson St
- 1036 E Hudson St
- 2447 Howey Rd
- 1033 Loretta Ave Unit 35
Your Personal Tour Guide
Ask me questions while you tour the home.