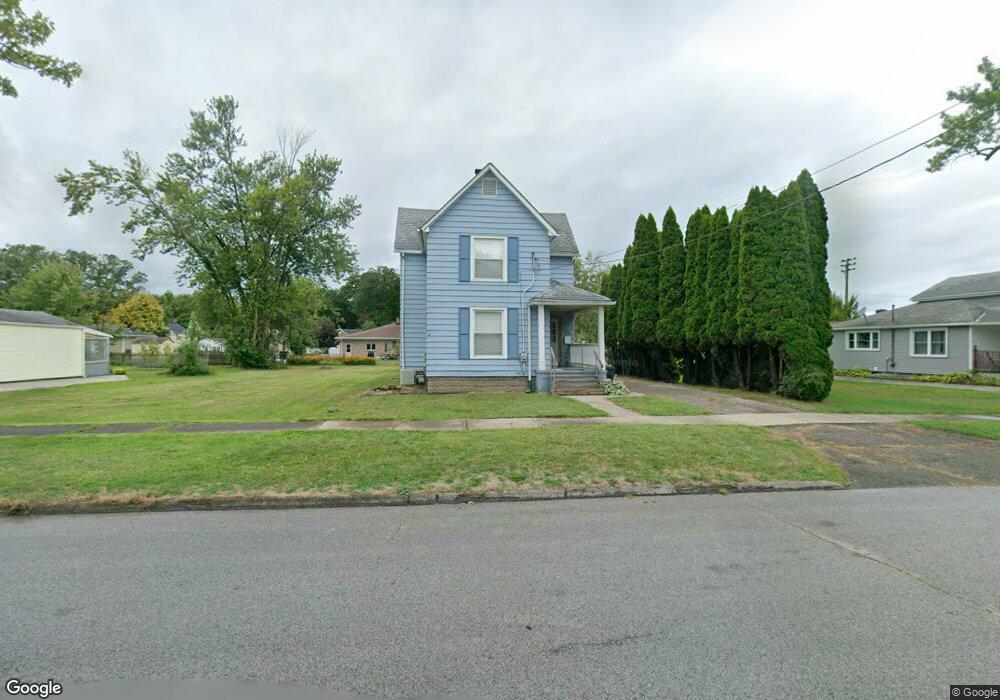
995 Mill St Conneaut, OH 44030
Estimated Value: $141,784 - $179,000
3
Beds
1
Bath
1,330
Sq Ft
$120/Sq Ft
Est. Value
About This Home
This home is located at 995 Mill St, Conneaut, OH 44030 and is currently estimated at $158,946, approximately $119 per square foot. 995 Mill St is a home located in Ashtabula County with nearby schools including Lakeshore Primary Elementary School, Gateway Elementary School, and Conneaut Middle School.
Ownership History
Date
Name
Owned For
Owner Type
Purchase Details
Closed on
Jun 10, 2018
Sold by
Lanton Investments Llc
Bought by
Benedict Karen T
Current Estimated Value
Home Financials for this Owner
Home Financials are based on the most recent Mortgage that was taken out on this home.
Original Mortgage
$73,737
Outstanding Balance
$63,770
Interest Rate
4.5%
Mortgage Type
New Conventional
Estimated Equity
$95,176
Purchase Details
Closed on
May 23, 2005
Sold by
Va
Bought by
Lanton Investments Llc
Purchase Details
Closed on
Dec 15, 2004
Sold by
Dragon Andrew K
Bought by
Va
Purchase Details
Closed on
Jul 17, 2000
Sold by
Marvin Gary R
Bought by
Dragon Andrew K and Dragon Amanda R
Home Financials for this Owner
Home Financials are based on the most recent Mortgage that was taken out on this home.
Original Mortgage
$64,800
Interest Rate
8.55%
Mortgage Type
VA
Create a Home Valuation Report for This Property
The Home Valuation Report is an in-depth analysis detailing your home's value as well as a comparison with similar homes in the area
Home Values in the Area
Average Home Value in this Area
Purchase History
| Date | Buyer | Sale Price | Title Company |
|---|---|---|---|
| Benedict Karen T | $73,100 | Chicago Title | |
| Lanton Investments Llc | -- | -- | |
| Va | $46,000 | -- | |
| Dragon Andrew K | $63,550 | -- |
Source: Public Records
Mortgage History
| Date | Status | Borrower | Loan Amount |
|---|---|---|---|
| Open | Benedict Karen T | $73,737 | |
| Previous Owner | Dragon Andrew K | $64,800 |
Source: Public Records
Tax History Compared to Growth
Tax History
| Year | Tax Paid | Tax Assessment Tax Assessment Total Assessment is a certain percentage of the fair market value that is determined by local assessors to be the total taxable value of land and additions on the property. | Land | Improvement |
|---|---|---|---|---|
| 2024 | $2,527 | $34,550 | $3,430 | $31,120 |
| 2023 | $1,635 | $34,550 | $3,430 | $31,120 |
| 2022 | $1,382 | $25,700 | $2,630 | $23,070 |
| 2021 | $1,405 | $25,700 | $2,630 | $23,070 |
| 2020 | $1,405 | $25,700 | $2,630 | $23,070 |
| 2019 | $836 | $14,950 | $1,260 | $13,690 |
| 2018 | $798 | $14,950 | $1,260 | $13,690 |
| 2017 | $797 | $14,950 | $1,260 | $13,690 |
| 2016 | $852 | $17,430 | $1,470 | $15,960 |
| 2015 | $911 | $17,430 | $1,470 | $15,960 |
| 2014 | $762 | $17,430 | $1,470 | $15,960 |
| 2013 | $1,879 | $21,430 | $2,210 | $19,220 |
Source: Public Records
Map
Nearby Homes
- 973 Buffalo St
- 290 Park Ave
- 1025 Harbor St Unit 35
- 0 Harbor St Unit 5122727
- 982 Day St
- 794 Buffalo St
- 770 Buffalo St
- 703 Sandusky St
- 716 Chestnut St
- 688 Grove St
- 169 River St
- 644 Mill St
- 630 Mill St
- 554 Sandusky St
- 0 Chestnut St Unit 5120761
- 533 Mill St
- 536 Mill St
- 381 Bliss Ave
- 405 Bliss Ave
- 281 Depot St