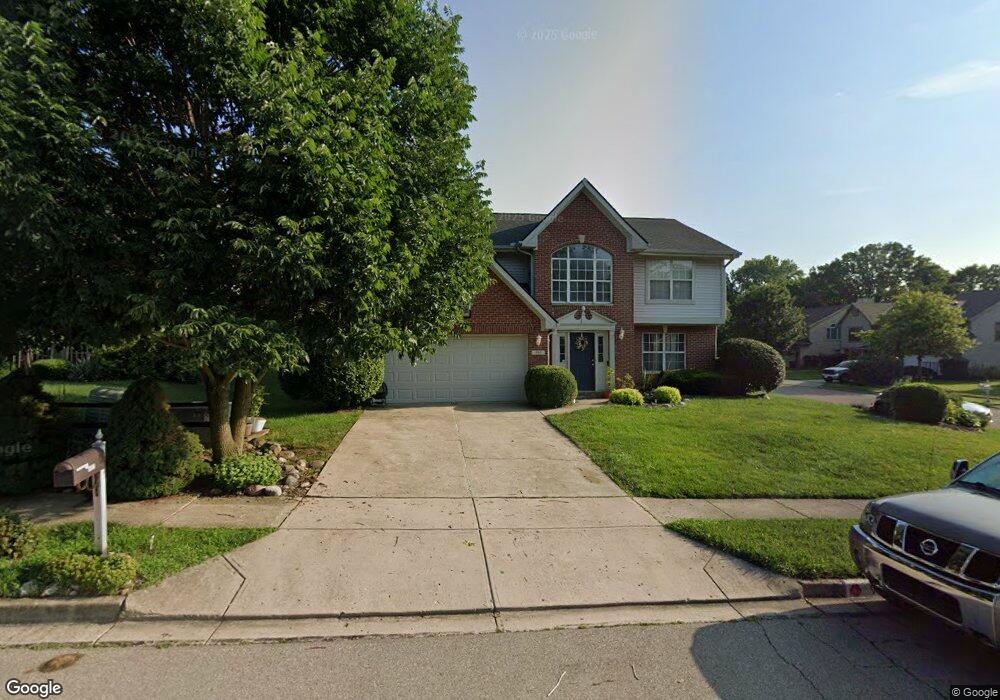
995 Mistic Ln Vandalia, OH 45377
Estimated Value: $319,876 - $349,000
4
Beds
3
Baths
2,295
Sq Ft
$148/Sq Ft
Est. Value
About This Home
This home is located at 995 Mistic Ln, Vandalia, OH 45377 and is currently estimated at $339,219, approximately $147 per square foot. 995 Mistic Ln is a home located in Montgomery County with nearby schools including Demmitt Elementary School, Smith Middle School, and Butler High School.
Ownership History
Date
Name
Owned For
Owner Type
Purchase Details
Closed on
Mar 19, 2014
Sold by
One West Bank Fsb
Bought by
Federal National Mortgage Association
Current Estimated Value
Purchase Details
Closed on
Jun 14, 2002
Sold by
Wasinski Keith E and Wasinski Holly J
Bought by
Ngan Lee T
Home Financials for this Owner
Home Financials are based on the most recent Mortgage that was taken out on this home.
Original Mortgage
$149,200
Interest Rate
6.87%
Purchase Details
Closed on
Aug 18, 2001
Sold by
Elliott Robert H and Elliott Isabelle R
Bought by
Wasinski Keith and Wasinski Holly
Home Financials for this Owner
Home Financials are based on the most recent Mortgage that was taken out on this home.
Original Mortgage
$184,000
Interest Rate
7.06%
Mortgage Type
Seller Take Back
Purchase Details
Closed on
Jun 23, 1994
Sold by
Donald L Huber Development Corp
Bought by
Wasinski Keith E and Wasinski Holly J
Create a Home Valuation Report for This Property
The Home Valuation Report is an in-depth analysis detailing your home's value as well as a comparison with similar homes in the area
Home Values in the Area
Average Home Value in this Area
Purchase History
| Date | Buyer | Sale Price | Title Company |
|---|---|---|---|
| Federal National Mortgage Association | $128,895 | None Available | |
| Ngan Lee T | $186,500 | Title Pointe Agency Inc | |
| Wasinski Keith | $187,000 | -- | |
| Wasinski Keith E | -- | -- |
Source: Public Records
Mortgage History
| Date | Status | Borrower | Loan Amount |
|---|---|---|---|
| Previous Owner | Ngan Lee T | $149,200 | |
| Previous Owner | Wasinski Keith | $184,000 |
Source: Public Records
Tax History Compared to Growth
Tax History
| Year | Tax Paid | Tax Assessment Tax Assessment Total Assessment is a certain percentage of the fair market value that is determined by local assessors to be the total taxable value of land and additions on the property. | Land | Improvement |
|---|---|---|---|---|
| 2024 | $4,473 | $85,820 | $21,260 | $64,560 |
| 2023 | $4,473 | $85,820 | $21,260 | $64,560 |
| 2022 | $4,098 | $63,570 | $15,750 | $47,820 |
| 2021 | $4,101 | $63,570 | $15,750 | $47,820 |
| 2020 | $4,085 | $63,570 | $15,750 | $47,820 |
| 2019 | $4,083 | $58,190 | $18,900 | $39,290 |
| 2018 | $4,091 | $58,190 | $18,900 | $39,290 |
| 2017 | $4,061 | $58,190 | $18,900 | $39,290 |
| 2016 | $3,805 | $53,570 | $15,750 | $37,820 |
| 2015 | $3,758 | $53,570 | $15,750 | $37,820 |
| 2014 | $3,758 | $53,570 | $15,750 | $37,820 |
| 2012 | -- | $59,840 | $15,750 | $44,090 |
Source: Public Records
Map
Nearby Homes
- 775 Cassel Creek Dr
- 92 Waller Ave
- 847 Waldsmith Way
- 113 Village Trail Dr Unit 6
- 113 Village Trail Dr Unit 2B
- 50 Clubhouse Way
- 552 Tionda Dr N
- 461 Poplar Grove Dr
- 770 Deer Creek Dr
- 1015 van Arden Dr
- 2070 Settlers Trail Unit UN2070
- 2082 Settlers Trail Unit 2082
- 2010 Settlers Trail
- 2050 Old Falls Dr
- 2014 Waterfall Ln
- 469 Farrell Rd
- 416 Bent Twig Dr
- 2082 Waterfall Ln
- 214 Marview Ave
- 314 N American Blvd
- 975 Mistic Ln
- 675 Golf View Ct
- 957 Mistic Ln
- 676 Cassel Creek Dr
- 655 Golf View Ct
- 990 Mistic Ln
- 680 Golf View Ct
- 970 Mistic Ln
- 1000 Mistic Ln
- 660 Cassel Creek Dr
- 635 Golf View Ct
- 660 Golf View Ct
- 1010 Mistic Ln
- 956 Mistic Ln
- 642 Cassel Creek Dr
- 650 Golf View Ct
- 630 Golf View Ct
- 1016 Mistic Ln
- 1021 Mistic Ln
- 615 Golf View Ct