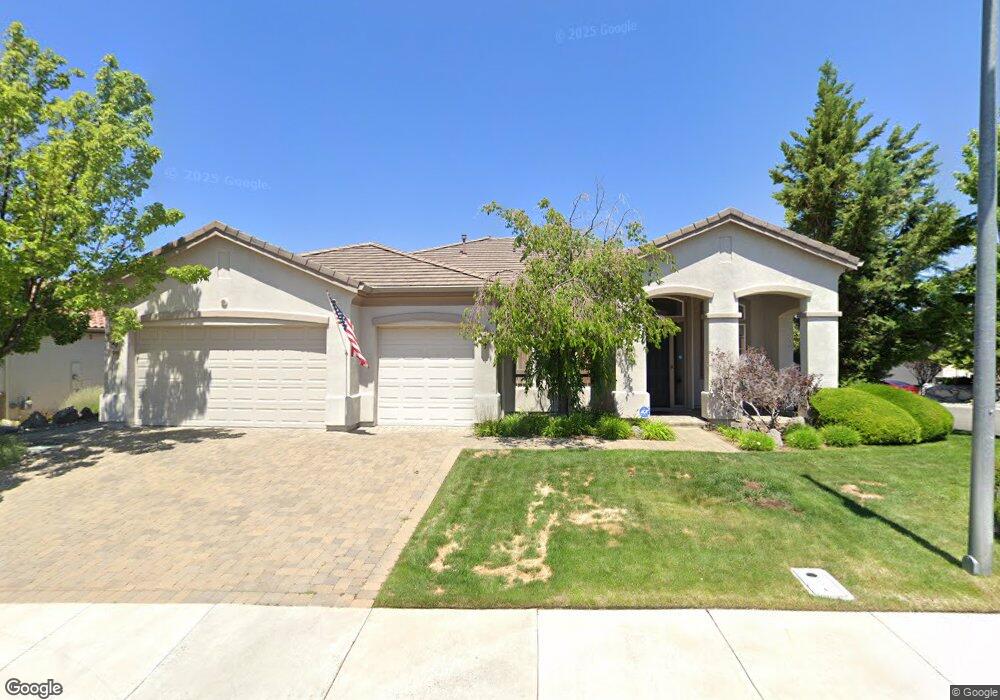
995 N University Park Loop Reno, NV 89512
West University NeighborhoodEstimated Value: $688,109 - $773,000
3
Beds
3
Baths
2,418
Sq Ft
$305/Sq Ft
Est. Value
About This Home
This home is located at 995 N University Park Loop, Reno, NV 89512 and is currently estimated at $736,777, approximately $304 per square foot. 995 N University Park Loop is a home located in Washoe County with nearby schools including Peavine Elementary School, Archie Clayton Pre-AP Academy, and Coral Academy Charter School Elementary.
Ownership History
Date
Name
Owned For
Owner Type
Purchase Details
Closed on
Feb 15, 2011
Sold by
Nash Noel F
Bought by
Nash Noel F and Noel F Nash Family Trust
Current Estimated Value
Home Financials for this Owner
Home Financials are based on the most recent Mortgage that was taken out on this home.
Original Mortgage
$184,000
Outstanding Balance
$125,342
Interest Rate
4.84%
Mortgage Type
New Conventional
Estimated Equity
$611,435
Purchase Details
Closed on
Feb 10, 2011
Sold by
English James W
Bought by
Nash Noel F
Home Financials for this Owner
Home Financials are based on the most recent Mortgage that was taken out on this home.
Original Mortgage
$184,000
Outstanding Balance
$125,342
Interest Rate
4.84%
Mortgage Type
New Conventional
Estimated Equity
$611,435
Purchase Details
Closed on
Sep 6, 2006
Sold by
Lennar Reno Llc
Bought by
Nash Noel F
Home Financials for this Owner
Home Financials are based on the most recent Mortgage that was taken out on this home.
Original Mortgage
$221,842
Interest Rate
6.56%
Mortgage Type
Unknown
Create a Home Valuation Report for This Property
The Home Valuation Report is an in-depth analysis detailing your home's value as well as a comparison with similar homes in the area
Home Values in the Area
Average Home Value in this Area
Purchase History
| Date | Buyer | Sale Price | Title Company |
|---|---|---|---|
| Nash Noel F | -- | None Available | |
| Nash Noel F | -- | Northern Nevada Title Cc | |
| Nash Noel F | $459,000 | North American Title Co |
Source: Public Records
Mortgage History
| Date | Status | Borrower | Loan Amount |
|---|---|---|---|
| Open | Nash Noel F | $184,000 | |
| Closed | Nash Noel F | $221,842 |
Source: Public Records
Tax History Compared to Growth
Tax History
| Year | Tax Paid | Tax Assessment Tax Assessment Total Assessment is a certain percentage of the fair market value that is determined by local assessors to be the total taxable value of land and additions on the property. | Land | Improvement |
|---|---|---|---|---|
| 2026 | $2,989 | $177,844 | $46,515 | $131,329 |
| 2025 | $3,880 | $179,661 | $46,515 | $133,146 |
| 2024 | $3,769 | $176,697 | $42,525 | $134,172 |
| 2023 | $2,736 | $170,949 | $44,520 | $126,429 |
| 2022 | $3,660 | $145,878 | $40,845 | $105,033 |
| 2021 | $3,555 | $133,305 | $28,980 | $104,325 |
| 2020 | $3,449 | $136,000 | $31,675 | $104,325 |
| 2019 | $3,351 | $131,226 | $30,625 | $100,601 |
| 2018 | $3,251 | $121,508 | $23,450 | $98,058 |
| 2017 | $3,156 | $119,664 | $21,525 | $98,139 |
| 2016 | $3,077 | $120,043 | $20,125 | $99,918 |
| 2015 | $2,984 | $110,633 | $18,305 | $92,328 |
| 2014 | $2,896 | $95,095 | $15,330 | $79,765 |
| 2013 | -- | $73,109 | $11,410 | $61,699 |
Source: Public Records
Map
Nearby Homes
- 1080 S University Park Loop
- 1120 University Park Ct
- 3715 Coastal St
- 3656 Ruidoso St
- 3621 Pimlico St
- 3510 Comstock Dr
- 3566 Penn National Dr
- 27 Chianti Way
- 29 Chianti Way
- 93 Cabernet Pkwy
- 45 Chablis Dr
- 18 Colombard Way
- 44 Chablis Dr
- 26 S Chardonnay St
- 23 Chablis Dr
- 970 Demos Ct
- 2135 Barberry Way
- 2140 Barberry Way
- 1176 Arrastra Rd Unit Lot 16
- 1172 Arrastra Rd
- 975 N University Park Loop
- 970 Sienna Park Dr
- 1190 S University Park Loop
- 965 N University Park Loop
- 985 Sienna Park Dr
- 975 Sienna Park Dr
- 980 N University Park Loop
- 965 Sienna Park Dr Unit 9
- 1170 S University Park Loop
- 960 Sienna Park Dr
- 970 N University Park Loop
- 955 N University Park Loop
- 955 Sienna Park Dr
- 960 N University Park Loop
- 1160 S University Park Loop Unit 9
- 3660 Sienna Vista Ct
- 945 N University Park Loop
- 950 Sienna Park Dr Unit 9
- 945 Sienna Park Dr
- 950 N University Park Loop