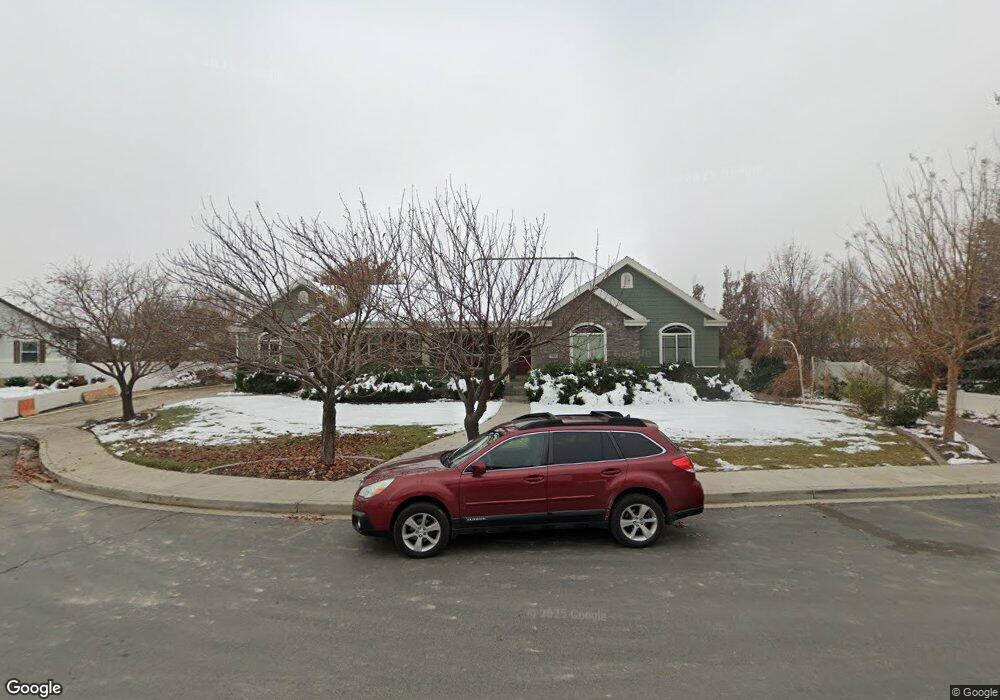
995 W 2020 N Pleasant Grove, UT 84062
Estimated Value: $882,000 - $1,048,000
5
Beds
4
Baths
2,460
Sq Ft
$386/Sq Ft
Est. Value
About This Home
This home is located at 995 W 2020 N, Pleasant Grove, UT 84062 and is currently estimated at $949,530, approximately $385 per square foot. 995 W 2020 N is a home located in Utah County with nearby schools including Manila Elementary School, Pleasant Grove Junior High School, and Pleasant Grove High School.
Ownership History
Date
Name
Owned For
Owner Type
Purchase Details
Closed on
Aug 10, 2021
Sold by
Rural Housing Development Corporation
Bought by
Mechling Kyle D and Mechling Kristine L
Current Estimated Value
Home Financials for this Owner
Home Financials are based on the most recent Mortgage that was taken out on this home.
Original Mortgage
$358,340
Outstanding Balance
$330,126
Interest Rate
2.9%
Mortgage Type
USDA
Estimated Equity
$619,404
Purchase Details
Closed on
Mar 19, 2002
Sold by
Dan & Dani Llc
Bought by
Gould Jamie S and Gould Justin G
Purchase Details
Closed on
Jan 18, 2002
Sold by
Chamberlin Jon and Ingram Dean
Bought by
Dan & Dani Llc
Create a Home Valuation Report for This Property
The Home Valuation Report is an in-depth analysis detailing your home's value as well as a comparison with similar homes in the area
Home Values in the Area
Average Home Value in this Area
Purchase History
| Date | Buyer | Sale Price | Title Company |
|---|---|---|---|
| Mechling Kyle D | -- | Backman Orem | |
| Gould Jamie S | -- | Backman Stewart Title Servic | |
| Dan & Dani Llc | -- | First American |
Source: Public Records
Mortgage History
| Date | Status | Borrower | Loan Amount |
|---|---|---|---|
| Open | Mechling Kyle D | $358,340 |
Source: Public Records
Tax History Compared to Growth
Tax History
| Year | Tax Paid | Tax Assessment Tax Assessment Total Assessment is a certain percentage of the fair market value that is determined by local assessors to be the total taxable value of land and additions on the property. | Land | Improvement |
|---|---|---|---|---|
| 2025 | $3,821 | $475,530 | $340,800 | $523,800 |
| 2024 | $3,606 | $445,940 | $0 | $0 |
| 2023 | $3,606 | $440,605 | $0 | $0 |
| 2022 | $3,999 | $486,200 | $0 | $0 |
| 2021 | $3,327 | $615,900 | $200,200 | $415,700 |
| 2020 | $3,163 | $573,900 | $185,400 | $388,500 |
| 2019 | $2,770 | $519,800 | $172,700 | $347,100 |
| 2018 | $2,832 | $502,500 | $168,500 | $334,000 |
| 2017 | $2,809 | $265,320 | $0 | $0 |
| 2016 | $2,644 | $241,120 | $0 | $0 |
| 2015 | $2,792 | $241,120 | $0 | $0 |
| 2014 | $2,682 | $229,460 | $0 | $0 |
Source: Public Records
Map
Nearby Homes
- 1897 N 900 W
- 980 W 1800 N
- 532 W 2000 N
- 674 W 1590 N Unit 11
- Konlee Plan at Makin Dreams
- Alexa Plan at Makin Dreams
- Callahan Plan at Makin Dreams
- Hailey Plan at Makin Dreams
- Alydia Plan at Makin Dreams
- Addison Plan at Makin Dreams
- Julia Plan at Makin Dreams
- 1531 N 750 W Unit 4
- Aaron Plan at Makin Dreams
- Amie Plan at Makin Dreams
- Nora Plan at Makin Dreams
- Emmet Plan at Makin Dreams
- Quinn Plan at Makin Dreams
- Chelsea Plan at Makin Dreams
- Jenni Plan at Makin Dreams
- Dakota Plan at Makin Dreams