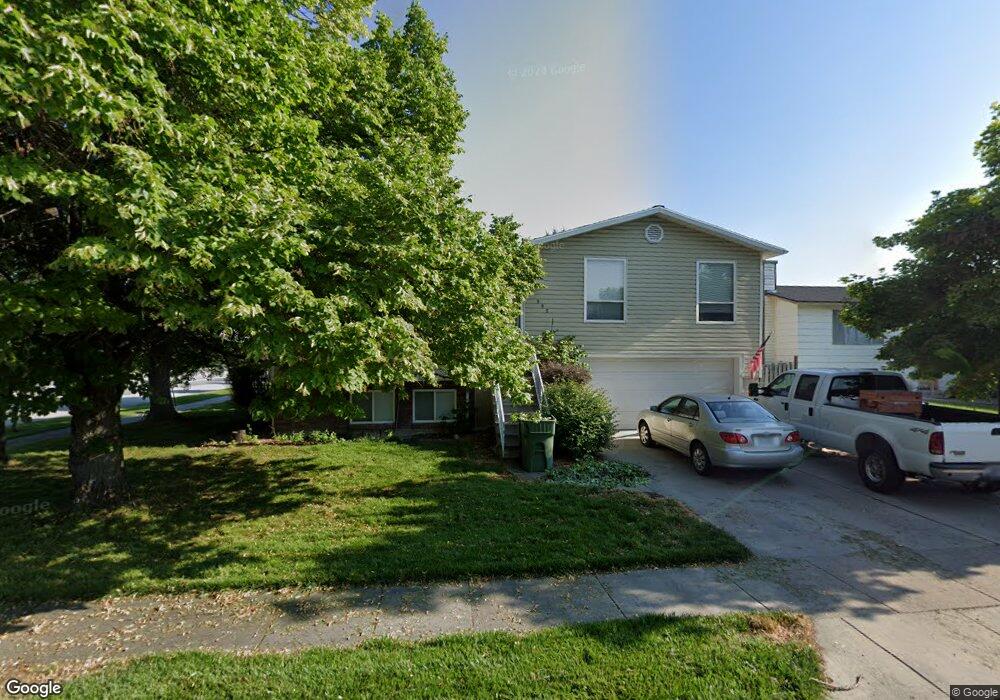
995 W 370 S Logan, UT 84321
Woodruff NeighborhoodEstimated Value: $380,502 - $405,000
4
Beds
2
Baths
2,016
Sq Ft
$195/Sq Ft
Est. Value
About This Home
This home is located at 995 W 370 S, Logan, UT 84321 and is currently estimated at $393,126, approximately $195 per square foot. 995 W 370 S is a home located in Cache County with nearby schools including Woodruff School, Mount Logan Middle School, and Logan High School.
Ownership History
Date
Name
Owned For
Owner Type
Purchase Details
Closed on
May 18, 2022
Sold by
Poppleton Karen S
Bought by
Winegar Derik and Winegar Anne
Current Estimated Value
Home Financials for this Owner
Home Financials are based on the most recent Mortgage that was taken out on this home.
Original Mortgage
$243,750
Outstanding Balance
$231,330
Interest Rate
5.3%
Mortgage Type
New Conventional
Estimated Equity
$161,796
Create a Home Valuation Report for This Property
The Home Valuation Report is an in-depth analysis detailing your home's value as well as a comparison with similar homes in the area
Home Values in the Area
Average Home Value in this Area
Purchase History
| Date | Buyer | Sale Price | Title Company |
|---|---|---|---|
| Winegar Derik | -- | Pinnacle Title |
Source: Public Records
Mortgage History
| Date | Status | Borrower | Loan Amount |
|---|---|---|---|
| Open | Winegar Derik | $243,750 |
Source: Public Records
Tax History
| Year | Tax Paid | Tax Assessment Tax Assessment Total Assessment is a certain percentage of the fair market value that is determined by local assessors to be the total taxable value of land and additions on the property. | Land | Improvement |
|---|---|---|---|---|
| 2025 | $1,594 | $206,170 | $0 | $0 |
| 2024 | $1,636 | $204,965 | $0 | $0 |
| 2023 | $1,692 | $202,070 | $0 | $0 |
| 2022 | $1,492 | $166,320 | $0 | $0 |
| 2021 | $1,411 | $243,000 | $45,000 | $198,000 |
| 2020 | $1,355 | $210,000 | $45,000 | $165,000 |
| 2019 | $1,096 | $162,622 | $45,000 | $117,622 |
| 2018 | $1,068 | $144,680 | $45,000 | $99,680 |
| 2017 | $968 | $69,300 | $0 | $0 |
| 2016 | $1,003 | $69,300 | $0 | $0 |
| 2015 | $1,005 | $69,300 | $0 | $0 |
| 2014 | $882 | $67,270 | $0 | $0 |
| 2013 | -- | $67,270 | $0 | $0 |
Source: Public Records
Map
Nearby Homes
- 1031 W 350 S
- 952 W 330 S
- 1400 S 940 W
- 207 Sunstone Cir
- 1099 Three Pointe Ave
- 370 S 1200 W Unit 2
- 501 Southwest St
- 508 S 1215 W Unit 144
- 553 Center Ave
- 539 S 1215 W Unit 129
- 245 S 1280 W
- 551 S 1215 W Unit 131
- 1204 W 575 S
- 1214 W 575 S
- 1210 W 575 S Unit 163
- 1210 W 575 S
- 1239 W 575 S
- 562 S 1215 W Unit 135
- 226 S 600 W
- 1615 Silver Canoe Way
Your Personal Tour Guide
Ask me questions while you tour the home.