Estimated Value: $566,000 - $635,000
4
Beds
3
Baths
3,233
Sq Ft
$190/Sq Ft
Est. Value
About This Home
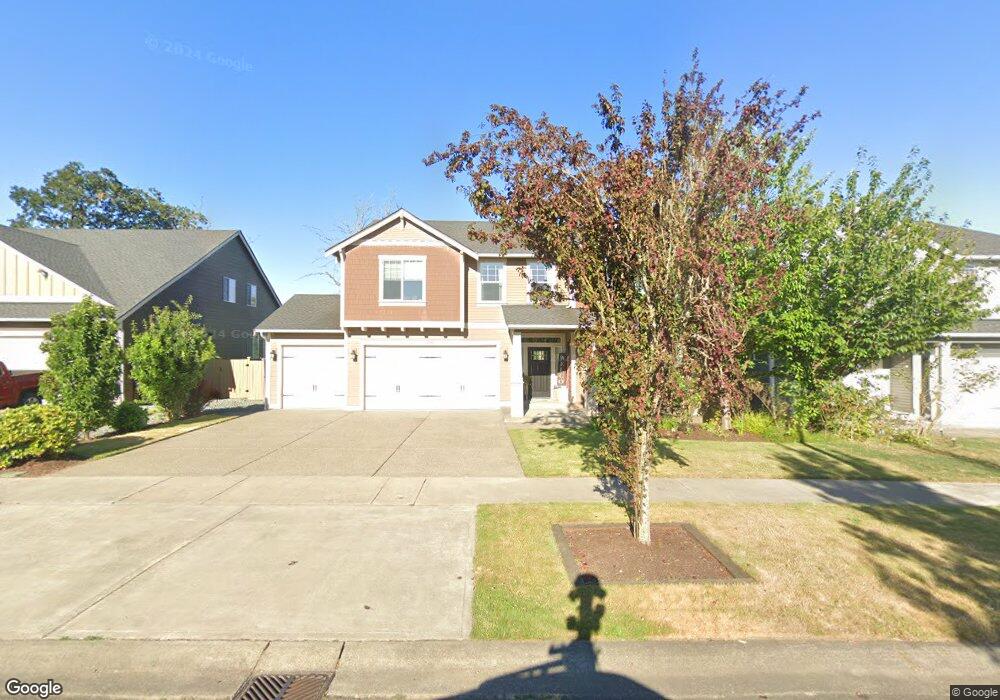
This home is located at 9951 Jensen Dr SE, Yelm, WA 98597 and is currently estimated at $613,924, approximately $189 per square foot. 9951 Jensen Dr SE is a home with nearby schools including Southworth Elementary School, Yelm Middle School, and Yelm High School.
Ownership History
Date
Name
Owned For
Owner Type
Purchase Details
Closed on
Nov 28, 2016
Sold by
Deschenes Mark Joseph
Bought by
Deschenes Cynthia Leah
Current Estimated Value
Purchase Details
Closed on
May 1, 2014
Sold by
Evergreen State Builder S Llc
Bought by
Deschenes Mark J and Deschenes Cynthia L
Home Financials for this Owner
Home Financials are based on the most recent Mortgage that was taken out on this home.
Original Mortgage
$256,950
Outstanding Balance
$78,743
Interest Rate
4.28%
Mortgage Type
New Conventional
Estimated Equity
$535,181
Purchase Details
Closed on
Oct 25, 2011
Sold by
Union Street Holdings Llc
Bought by
Tahoma Terra Holding Llc
Home Financials for this Owner
Home Financials are based on the most recent Mortgage that was taken out on this home.
Original Mortgage
$2,517,804
Interest Rate
4.01%
Mortgage Type
Unknown
Purchase Details
Closed on
Apr 12, 2010
Sold by
Ttph 3 & 8 Llc
Bought by
Union Street Holdings Llc
Create a Home Valuation Report for This Property
The Home Valuation Report is an in-depth analysis detailing your home's value as well as a comparison with similar homes in the area
Home Values in the Area
Average Home Value in this Area
Purchase History
| Date | Buyer | Sale Price | Title Company |
|---|---|---|---|
| Deschenes Cynthia Leah | -- | None Available | |
| Deschenes Mark J | $246,648 | First American Title | |
| Tahoma Terra Holding Llc | $2,500,000 | First American Title | |
| Union Street Holdings Llc | $16,014,849 | First American Title |
Source: Public Records
Mortgage History
| Date | Status | Borrower | Loan Amount |
|---|---|---|---|
| Open | Deschenes Mark J | $256,950 | |
| Previous Owner | Tahoma Terra Holding Llc | $2,517,804 |
Source: Public Records
Tax History Compared to Growth
Tax History
| Year | Tax Paid | Tax Assessment Tax Assessment Total Assessment is a certain percentage of the fair market value that is determined by local assessors to be the total taxable value of land and additions on the property. | Land | Improvement |
|---|---|---|---|---|
| 2024 | $5,285 | $612,200 | $130,400 | $481,800 |
| 2023 | $5,285 | $541,800 | $106,800 | $435,000 |
| 2022 | $5,452 | $601,500 | $52,800 | $548,700 |
| 2021 | $4,771 | $495,600 | $60,100 | $435,500 |
| 2020 | $4,591 | $377,000 | $44,600 | $332,400 |
| 2019 | $1,269 | $354,400 | $38,100 | $316,300 |
| 2018 | $4,798 | $354,100 | $20,300 | $333,800 |
| 2017 | $4,342 | $336,100 | $21,000 | $315,100 |
| 2016 | $4,047 | $311,650 | $32,150 | $279,500 |
| 2014 | -- | $295,500 | $31,500 | $264,000 |
Source: Public Records
Map
Nearby Homes
- 9867 Jensen Dr SE
- 14426 99th Ave SE
- 14420 99th Ave SE
- 10071 Jensen Dr SE
- 14396 99th Ave SE
- 14399 98th Way SE
- 14818 99th Way SE
- 9986 Charles St
- The Willow Plan at Tahoma Terra
- The Camden Plan at Tahoma Terra
- The Sterling Plan at Tahoma Terra
- The Wren Plan at Tahoma Terra
- The Timber Plan at Tahoma Terra
- The Blossom Plan at Tahoma Terra
- The Laurel Plan at Tahoma Terra
- The Teton Plan at Tahoma Terra
- The Sutton Plan at Tahoma Terra
- The Cedar Plan at Tahoma Terra
- 14854 99th Way SE
- 14858 99th Ave SE
- 9957 Jensen Dr SE
- 9939 Jensen Dr SE
- 9963 Jensen Dr SE
- 9933 Jensen Dr SE
- 9950 Jensen Dr SE
- 9944 Jensen Dr SE
- 9956 Jensen Dr SE
- 9969 Jensen Dr SE
- 9938 Jensen Dr SE
- 9962 Jensen Dr SE
- 9922 Jensen Dr SE
- 9975 Jensen Dr SE
- 9974 Jensen Dr SE
- 9921 Jensen Dr SE
- 9926 Jensen Dr SE
- 9955 Dotson St SE
- 9949 Dotson St SE
- 9961 Dotson St SE