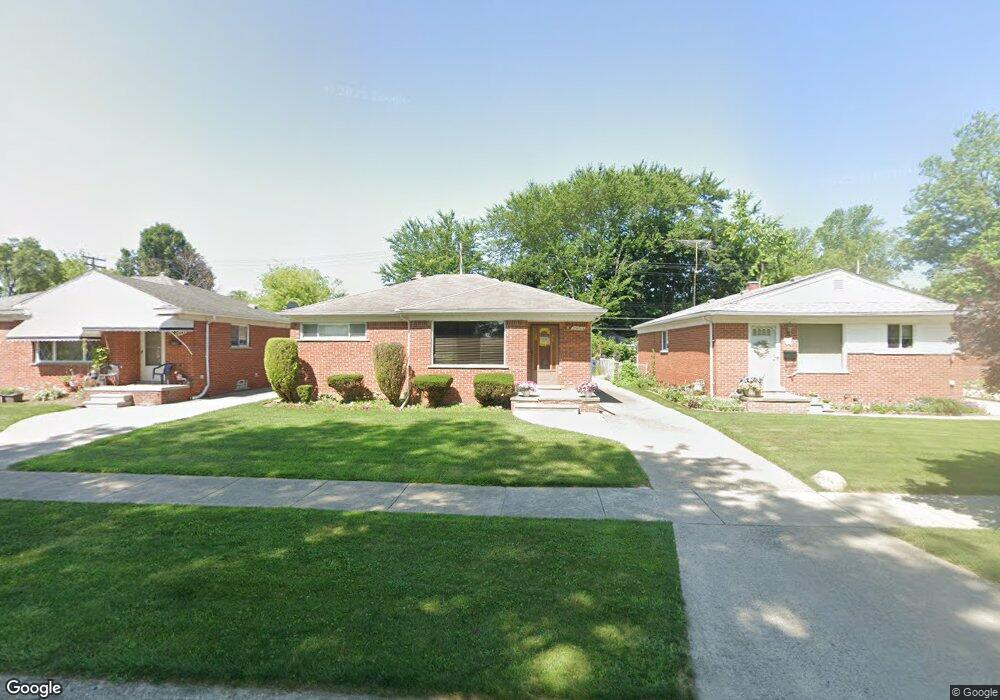
9959 Brady Redford, MI 48239
Estimated Value: $177,000 - $191,000
Studio
2
Baths
1,002
Sq Ft
$186/Sq Ft
Est. Value
About This Home
This home is located at 9959 Brady, Redford, MI 48239 and is currently estimated at $186,005, approximately $185 per square foot. 9959 Brady is a home located in Wayne County with nearby schools including John D. Pierce Middle School, Lee M. Thurston High School, and Washington-Parks Academy.
Ownership History
Date
Name
Owned For
Owner Type
Purchase Details
Closed on
Dec 7, 2020
Sold by
Adams Patricia A
Bought by
Adams Jeffrey D
Current Estimated Value
Home Financials for this Owner
Home Financials are based on the most recent Mortgage that was taken out on this home.
Original Mortgage
$85,500
Outstanding Balance
$69,294
Interest Rate
2.8%
Mortgage Type
New Conventional
Estimated Equity
$116,711
Purchase Details
Closed on
Apr 2, 2002
Sold by
Adams Jeffrey A
Bought by
Adams Jeffrey D
Purchase Details
Closed on
Oct 29, 1999
Sold by
Nawrocki Carol A
Bought by
Adams Jeffrey D
Create a Home Valuation Report for This Property
The Home Valuation Report is an in-depth analysis detailing your home's value as well as a comparison with similar homes in the area
Home Values in the Area
Average Home Value in this Area
Purchase History
| Date | Buyer | Sale Price | Title Company |
|---|---|---|---|
| Adams Jeffrey D | -- | None Available | |
| Adams Jeffrey D | -- | -- | |
| Adams Jeffrey D | $117,500 | -- |
Source: Public Records
Mortgage History
| Date | Status | Borrower | Loan Amount |
|---|---|---|---|
| Open | Adams Jeffrey D | $85,500 |
Source: Public Records
Tax History
| Year | Tax Paid | Tax Assessment Tax Assessment Total Assessment is a certain percentage of the fair market value that is determined by local assessors to be the total taxable value of land and additions on the property. | Land | Improvement |
|---|---|---|---|---|
| 2025 | $756 | $83,400 | $0 | $0 |
| 2024 | $736 | $76,300 | $0 | $0 |
| 2023 | $704 | $68,700 | $0 | $0 |
| 2022 | $2,080 | $58,300 | $0 | $0 |
| 2021 | $2,021 | $55,100 | $0 | $0 |
| 2020 | $1,994 | $49,500 | $0 | $0 |
| 2019 | $1,952 | $44,900 | $0 | $0 |
| 2018 | $634 | $36,600 | $0 | $0 |
| 2017 | $2,194 | $34,000 | $0 | $0 |
| 2016 | $1,710 | $31,500 | $0 | $0 |
| 2015 | $2,663 | $29,100 | $0 | $0 |
| 2013 | $2,580 | $26,300 | $0 | $0 |
| 2012 | $1,645 | $29,000 | $7,200 | $21,800 |
Source: Public Records
Map
Nearby Homes
Your Personal Tour Guide
Ask me questions while you tour the home.