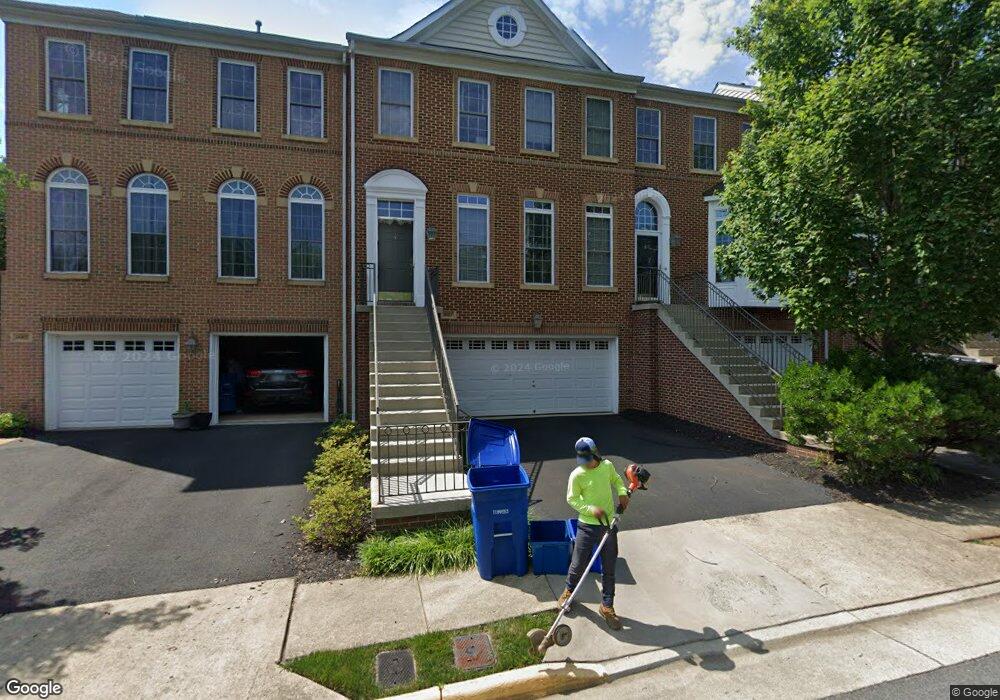
9959 Cyrandall Dr Oakton, VA 22124
Estimated Value: $913,654 - $961,000
4
Beds
4
Baths
2,206
Sq Ft
$421/Sq Ft
Est. Value
About This Home
This home is located at 9959 Cyrandall Dr, Oakton, VA 22124 and is currently estimated at $929,414, approximately $421 per square foot. 9959 Cyrandall Dr is a home located in Fairfax County with nearby schools including Thoreau Middle School, Appletree School, and Pinnacle Academy.
Ownership History
Date
Name
Owned For
Owner Type
Purchase Details
Closed on
Nov 16, 2010
Sold by
Total Investments Llc
Bought by
Singh Gaurav K and Arora Neha
Current Estimated Value
Home Financials for this Owner
Home Financials are based on the most recent Mortgage that was taken out on this home.
Original Mortgage
$566,831
Outstanding Balance
$374,558
Interest Rate
4.3%
Mortgage Type
FHA
Estimated Equity
$554,856
Purchase Details
Closed on
May 14, 2010
Sold by
Professional Foreclosure Corp and Gordon Neil J
Bought by
Total Investments Llc
Home Financials for this Owner
Home Financials are based on the most recent Mortgage that was taken out on this home.
Original Mortgage
$385,070
Interest Rate
5.23%
Mortgage Type
Construction
Purchase Details
Closed on
Sep 12, 2002
Sold by
Winchester Homes Inc
Bought by
Gordon Johanna
Home Financials for this Owner
Home Financials are based on the most recent Mortgage that was taken out on this home.
Original Mortgage
$349,100
Interest Rate
6.48%
Create a Home Valuation Report for This Property
The Home Valuation Report is an in-depth analysis detailing your home's value as well as a comparison with similar homes in the area
Home Values in the Area
Average Home Value in this Area
Purchase History
| Date | Buyer | Sale Price | Title Company |
|---|---|---|---|
| Singh Gaurav K | $610,000 | -- | |
| Total Investments Llc | $550,100 | -- | |
| Gordon Johanna | $436,380 | -- |
Source: Public Records
Mortgage History
| Date | Status | Borrower | Loan Amount |
|---|---|---|---|
| Open | Singh Gaurav K | $566,831 | |
| Previous Owner | Total Investments Llc | $385,070 | |
| Previous Owner | Gordon Johanna | $349,100 |
Source: Public Records
Tax History Compared to Growth
Tax History
| Year | Tax Paid | Tax Assessment Tax Assessment Total Assessment is a certain percentage of the fair market value that is determined by local assessors to be the total taxable value of land and additions on the property. | Land | Improvement |
|---|---|---|---|---|
| 2025 | $9,519 | $842,340 | $225,000 | $617,340 |
| 2024 | $9,519 | $821,680 | $215,000 | $606,680 |
| 2023 | $8,698 | $770,800 | $215,000 | $555,800 |
| 2022 | $8,521 | $745,150 | $205,000 | $540,150 |
| 2021 | $7,986 | $680,560 | $205,000 | $475,560 |
| 2020 | $7,829 | $661,530 | $195,000 | $466,530 |
| 2019 | $7,782 | $657,580 | $195,000 | $462,580 |
| 2018 | $7,406 | $644,040 | $185,000 | $459,040 |
| 2017 | $7,400 | $637,400 | $180,000 | $457,400 |
| 2016 | $7,384 | $637,400 | $180,000 | $457,400 |
| 2015 | $6,571 | $588,840 | $175,000 | $413,840 |
| 2014 | $6,557 | $588,840 | $175,000 | $413,840 |
Source: Public Records
Map
Nearby Homes
- 9908 Blake Ln
- 2960 Hibbard St
- 3154 Valentino Ct
- 10172 Turnberry Place
- 10208 Bushman Dr
- 10208 Bushman Dr Unit 422
- 9914 Brightlea Dr
- 9744 Water Oak Dr
- 10195A Ashbrooke Ct Unit 109
- 3010 Steven Martin Dr
- 9720 Five Oaks Rd
- 10300 Bushman Dr Unit 201
- 9800 Kingsbridge Dr Unit 2
- 3179 Summit Square Dr Unit 2-B5
- 9715 Kings Crown Ct Unit 202
- 9713 Kings Crown Ct Unit 1
- 9730 Kingsbridge Dr Unit 202
- 9927 Miles Stone Ct
- 10230 Antietam Ave
- 10123 Fair Woods Dr
- 9961 Cyrandall Dr
- 9957 Cyrandall Dr
- 9963 Cyrandall Dr
- 9955 Cyrandall Dr
- 9951 Cyrandall Dr
- 9965 Cyrandall Dr
- 9967 Cyrandall Dr
- 9917 Cyrandall Place
- 9964 Cyrandall Dr
- 9969 Cyrandall Dr
- 9915 Cyrandall Place
- 9966 Cyrandall Dr
- 9971 Cyrandall Dr
- 9913 Cyrandall Place
- 9970 Cyrandall Dr
- 9973 Cyrandall Dr
- 9911 Cyrandall Place
- 9972 Cyrandall Dr
- 9975 Cyrandall Dr
- 9918 Cyrandall Place