$229,000 - $241,000
RENTED NOV 8, 2024

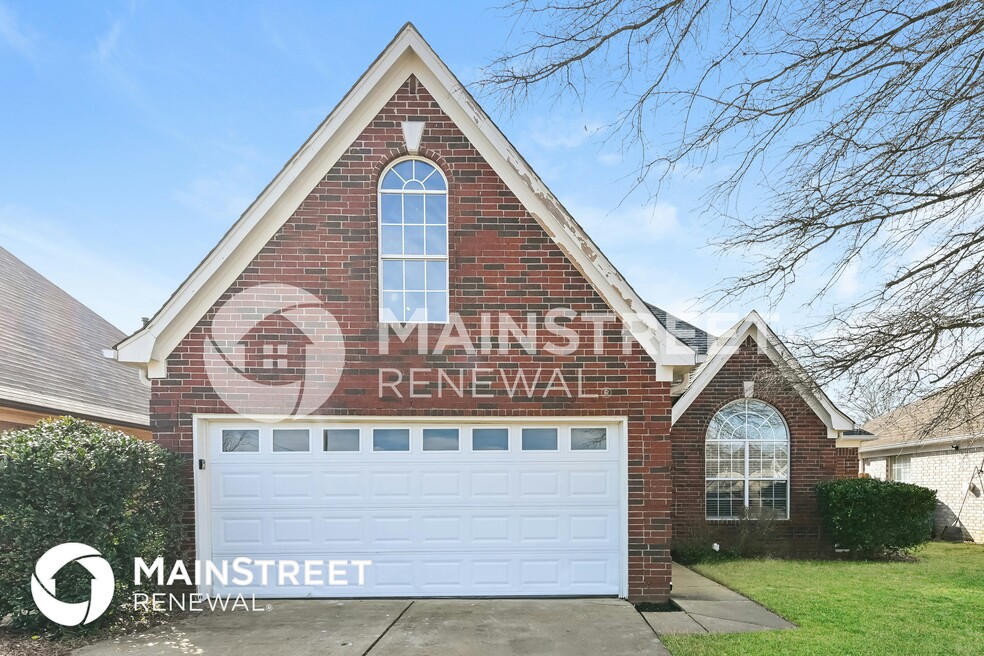
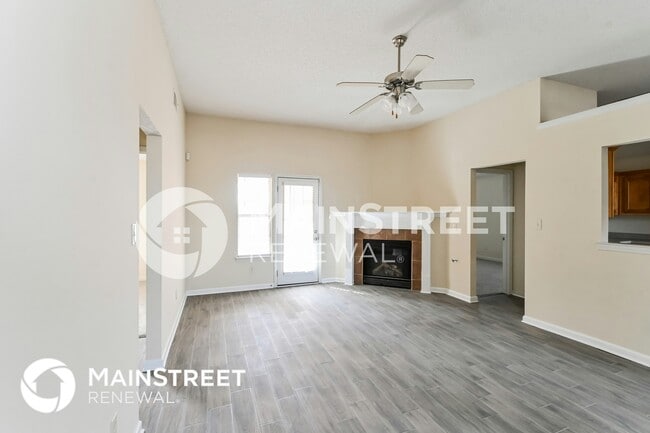
9959 Stage Run Dr Olive Branch, MS 38654
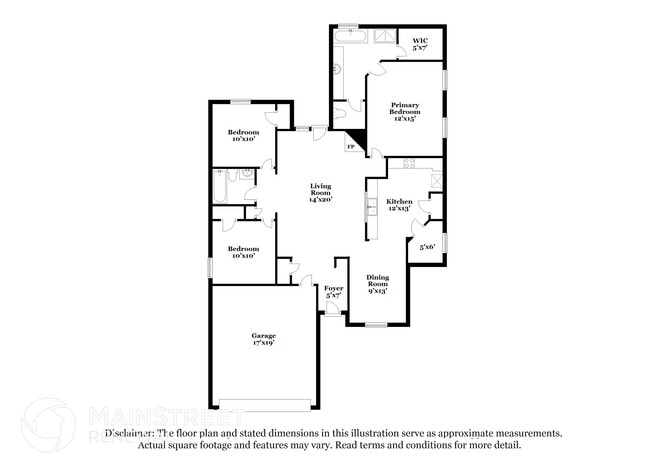
3 Beds
2 Baths
1,515 Sq Ft
$156 Price per Sq Ft

Last Sold December 06, 2023

Current estimated payment $1,510/month

About This Home

As of December 2023

Looking for your dream home? Through our seamless leasing process, this beautifully designed home is move-in ready. Our spacious layout is perfect for comfortable living that you can enjoy with your pets too; we're proud to be pet friendly. Our homes are built using high-quality, eco-friendly materials with neutral paint colors, updated fixtures, and energy-efficient appliances.

Ownership History

Date Name Owned For Owner Type

Purchase Details

Listed on
Oct 25, 2023
Closed on
Dec 6, 2023
Sold by
Perry Glenn P
Bought by
Armm Asset Company 2 Llc
Seller's Agent
Kelly Powell
RE/MAX Realty Group
Buyer's Agent
SPENCER LINDAHL
HERITAGE REALTY
List Price
$242,000
Sold Price
$226,000
Premium/Discount to List
-$16,000
-6.61%
Views
56
Current Estimated Value
$235,743

Home Financials for this Owner

Home Financials are based on the most recent Mortgage that was taken out on this home.
Estimated Appreciation
$9,743
Avg. Annual Appreciation
2.83%
Source: Public Records

Range of Values:

Collateral Analytics

Collateral Analytics Collateral Analytics AVMs (Automated Valuation Model) employ a number of statistical approaches combined with neighborhood-specific comparable selection guarantees the most up-to-date and precise valuations.

Not Available

Collateral Analytics does not have data for the current month. Please view the chart for historical values.

ICE

ICE Mortgage Technology ICE Mortgage Technology’s AVM (Automated Valuation Model) is a state-of-the-art online residential property valuation tool that provides a quick and accurate estimate of the value of almost any home in the U.S.

Not Available

ICE Mortgage Technology does not have data for the current month. Please view the chart for historical values.

First American

First American First American Data & Analytics’ next-generation AVM combines unrivaled data assets with a blended ensemble of valuation models to produce highly accurate, reliable valuations you can trust.

Not Available

First American does not have data for the current month. Please view the chart for historical values.

Quantarium

Quantarium Quantarium’s valuation service, repeatedly proven the industry’s most accurate and comprehensive, is supercharged with a self-learning and auto-tuning AI engine that continually becomes smarter and more accurate as it processes daily inputs from the industry’s leading RE data lake.

Not Available

Quantarium does not have data for the current month. Please view the chart for historical values.

Average Value
Not Available
List Price
Sold Price
Create a Home Valuation Report for This Property
The Home Valuation Report is an in-depth analysis detailing your home's value as well as a comparison with similar homes in the area

Home Values in the Area

Source: Public Records

Average Home Value in this Area


Source: Public Records

Purchase History

Date Buyer Sale Price Title Company
Armm Asset Company 2 Llc -- Summit Title & Escrow
Source: Public Records

Property History

Date Event Price Change Sq Ft Price
11/08/2024 11/08/24 Rented $1,785 0.0% --
09/16/2024 09/16/24 Price Changed $1,785 -1.4% $1 / Sq Ft
09/08/2024 09/08/24 For Rent $1,810 -7.7% --
06/18/2024 06/18/24 Price Changed $1,960 -1.3% $1 / Sq Ft
02/09/2024 02/09/24 For Rent $1,985 0.0% --
12/06/2023 12/06/23 Sold -- -- --
11/08/2023 11/08/23 Pending -- -- --
10/25/2023 10/25/23 For Sale $242,000 -- $160 / Sq Ft

Tax History Compared to Growth

Source: Public Records

Tax History

Year Tax Paid Tax Assessment Tax Assessment Total Assessment is a certain percentage of the fair market value that is determined by local assessors to be the total taxable value of land and additions on the property. Land Improvement
2024 $2,286 $16,747 $3,750 $12,997
2023 $2,286 $11,165 $0 $0
2022 $1,224 $11,165 $2,500 $8,665
2021 $1,224 $11,165 $2,500 $8,665
2020 $1,122 $10,417 $2,500 $7,917
2019 $1,122 $10,417 $2,500 $7,917
2017 $1,098 $17,874 $10,187 $7,687
2016 $1,098 $10,187 $2,500 $7,687
2015 $1,398 $17,874 $10,187 $7,687
2014 $1,191 $10,869 $0 $0
2013 $1,059 $10,869 $0 $0
Source: Public Records

Agents Affiliated with this Home

  • Section Image
  • Section Image
See All Agents

Map