Estimated Value: $117,000 - $140,000
1
Bed
1
Bath
976
Sq Ft
$133/Sq Ft
Est. Value
About This Home
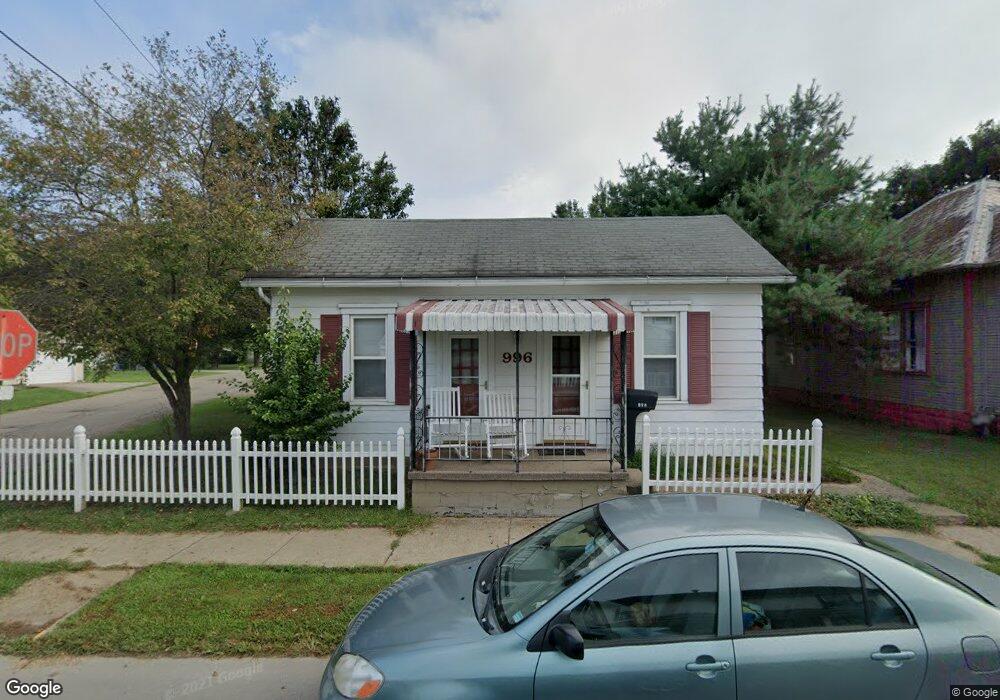
This home is located at 996 3rd St, Logan, OH 43138 and is currently estimated at $129,338, approximately $132 per square foot. 996 3rd St is a home located in Hocking County with nearby schools including Chieftain Elementary School, St. John the Evangelist School, and Logan Christian School.
Ownership History
Date
Name
Owned For
Owner Type
Purchase Details
Closed on
Aug 22, 2024
Sold by
Vaughan Frederick K
Bought by
Conner Vernon L and Conner Joyce A
Current Estimated Value
Home Financials for this Owner
Home Financials are based on the most recent Mortgage that was taken out on this home.
Original Mortgage
$116,161
Outstanding Balance
$114,852
Interest Rate
6.89%
Mortgage Type
New Conventional
Estimated Equity
$14,486
Purchase Details
Closed on
Mar 7, 2013
Sold by
Steward Charles M and Steward Constance
Bought by
Vaughan Frederick K and Vaughan Sandra K
Home Financials for this Owner
Home Financials are based on the most recent Mortgage that was taken out on this home.
Original Mortgage
$61,440
Interest Rate
3.38%
Mortgage Type
New Conventional
Purchase Details
Closed on
Feb 23, 2006
Sold by
Steward Charles M and Steward Constance S
Bought by
Steward Charles M and Steward Constance S
Purchase Details
Closed on
Jul 13, 2003
Bought by
Vaughn Frederick K and Vaughn Sandra K
Create a Home Valuation Report for This Property
The Home Valuation Report is an in-depth analysis detailing your home's value as well as a comparison with similar homes in the area
Home Values in the Area
Average Home Value in this Area
Purchase History
| Date | Buyer | Sale Price | Title Company |
|---|---|---|---|
| Conner Vernon L | $115,000 | Valmer Land Title | |
| Conner Vernon L | $115,000 | Valmer Land Title | |
| Vaughan Frederick K | $60,000 | None Available | |
| Steward Charles M | -- | None Available | |
| Vaughn Frederick K | $60,000 | -- |
Source: Public Records
Mortgage History
| Date | Status | Borrower | Loan Amount |
|---|---|---|---|
| Open | Conner Vernon L | $116,161 | |
| Closed | Conner Vernon L | $116,161 | |
| Previous Owner | Vaughan Frederick K | $61,440 |
Source: Public Records
Tax History Compared to Growth
Tax History
| Year | Tax Paid | Tax Assessment Tax Assessment Total Assessment is a certain percentage of the fair market value that is determined by local assessors to be the total taxable value of land and additions on the property. | Land | Improvement |
|---|---|---|---|---|
| 2024 | $541 | $23,550 | $4,800 | $18,750 |
| 2023 | $541 | $23,550 | $4,800 | $18,750 |
| 2022 | $583 | $23,550 | $4,800 | $18,750 |
| 2021 | $406 | $18,300 | $3,340 | $14,960 |
| 2020 | $406 | $18,300 | $3,340 | $14,960 |
| 2019 | $406 | $18,300 | $3,340 | $14,960 |
| 2018 | $716 | $17,120 | $2,910 | $14,210 |
| 2017 | $674 | $17,120 | $2,910 | $14,210 |
| 2016 | $669 | $17,120 | $2,910 | $14,210 |
| 2015 | $688 | $16,950 | $3,640 | $13,310 |
| 2014 | $688 | $16,950 | $3,640 | $13,310 |
| 2013 | $690 | $16,950 | $3,640 | $13,310 |
Source: Public Records
Map
Nearby Homes
- 331 Short St
- 345 Short St
- 737 Glenwood Dr
- 605 Glenwood Dr
- 150 Wood St
- 597 Henrietta Ave
- 171 Warner Ave
- 385 W Main St
- 67 W Front St
- 28583 Hawthorne Way
- 687 N Walnut St
- 1139 Old McArthur Rd
- 862 Walnut Dowler Rd
- State Route 328
- 288 Walnut Dr
- 743 Summit Dr
- 90 S Culver St
- 707 Edgehill Dr
- 849 Mohican Ave
- 825 Edgehill Dr