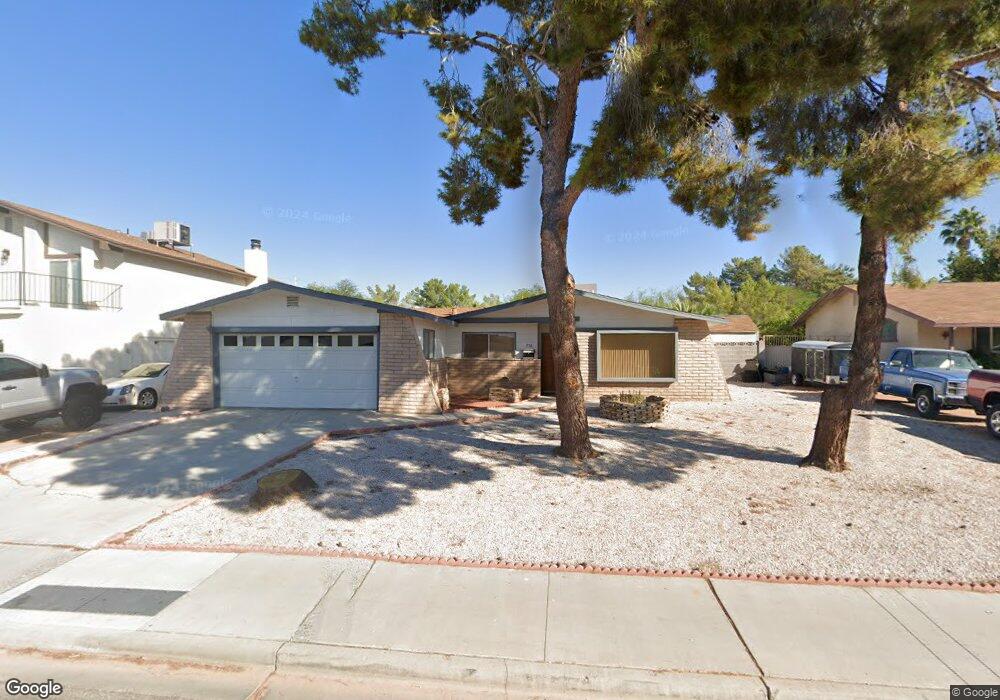
996 El Camino Way Boulder City, NV 89005
Estimated Value: $471,000 - $534,000
3
Beds
2
Baths
1,557
Sq Ft
$314/Sq Ft
Est. Value
About This Home
This home is located at 996 El Camino Way, Boulder City, NV 89005 and is currently estimated at $488,769, approximately $313 per square foot. 996 El Camino Way is a home located in Clark County with nearby schools including Andrew Mitchell Elementary School, Martha P. King Elementary School, and Elton M. & Madelaine E. Garrett Junior High School.
Ownership History
Date
Name
Owned For
Owner Type
Purchase Details
Closed on
Jun 9, 2006
Sold by
Kimberlin Kay
Bought by
Kimberlin Kay
Current Estimated Value
Home Financials for this Owner
Home Financials are based on the most recent Mortgage that was taken out on this home.
Original Mortgage
$162,000
Outstanding Balance
$66,570
Interest Rate
1.5%
Mortgage Type
Negative Amortization
Estimated Equity
$422,199
Purchase Details
Closed on
Mar 21, 2000
Sold by
Rants John T and Rants Dorothy E
Bought by
Rants John T and Rants Dorothy E
Purchase Details
Closed on
Dec 22, 1993
Sold by
Rogers Allen L
Bought by
Kimberlin William and Kimberlin Kay
Home Financials for this Owner
Home Financials are based on the most recent Mortgage that was taken out on this home.
Original Mortgage
$94,000
Interest Rate
7.38%
Create a Home Valuation Report for This Property
The Home Valuation Report is an in-depth analysis detailing your home's value as well as a comparison with similar homes in the area
Home Values in the Area
Average Home Value in this Area
Purchase History
| Date | Buyer | Sale Price | Title Company |
|---|---|---|---|
| Kimberlin Kay | -- | Commonwealth Title | |
| Rants John T | -- | -- | |
| Kimberlin William | $140,000 | Nevada Title Company |
Source: Public Records
Mortgage History
| Date | Status | Borrower | Loan Amount |
|---|---|---|---|
| Open | Kimberlin Kay | $162,000 | |
| Closed | Kimberlin William | $94,000 | |
| Closed | Kimberlin William | $9,000 |
Source: Public Records
Tax History Compared to Growth
Tax History
| Year | Tax Paid | Tax Assessment Tax Assessment Total Assessment is a certain percentage of the fair market value that is determined by local assessors to be the total taxable value of land and additions on the property. | Land | Improvement |
|---|---|---|---|---|
| 2025 | $1,733 | $83,958 | $58,100 | $25,858 |
| 2024 | $1,604 | $83,958 | $58,100 | $25,858 |
| 2023 | $1,604 | $67,116 | $43,750 | $23,366 |
| 2022 | $1,485 | $59,072 | $38,150 | $20,922 |
| 2021 | $1,375 | $56,975 | $36,400 | $20,575 |
| 2020 | $1,277 | $56,434 | $35,350 | $21,084 |
| 2019 | $1,197 | $51,204 | $29,750 | $21,454 |
| 2018 | $1,142 | $51,036 | $29,750 | $21,286 |
| 2017 | $1,357 | $51,956 | $29,750 | $22,206 |
| 2016 | $1,068 | $47,756 | $24,500 | $23,256 |
| 2015 | $1,066 | $41,005 | $17,500 | $23,505 |
| 2014 | $1,033 | $38,717 | $15,750 | $22,967 |
Source: Public Records
Map
Nearby Homes
- 976 El Camino Way
- 1437 Cattail Falls St
- 1505 Carlsbad St
- 1414 Cattail Falls St
- 1000 Legacy Dr
- 1511 Irene Dr
- 1010 Legacy Dr
- 873 Montera Ln
- 1527 Irene Dr
- 834 Benita Place
- 839 Benita Place
- 855 Del Rey Dr
- 782 Sandra Dr
- 893 Fairway Dr
- 1321 Nadine Way
- 1319 Red Baron Ln
- 776 San Remo Way
- 798 Fairway Dr
- 1317 Yucca St
- 1316 Capri Dr Unit A,B,C,&D
- 994 El Camino Way
- 998 El Camino Way
- 992 El Camino Way
- 997 El Camino Way
- 995 El Camino Way
- 999 El Camino Way
- 993 El Camino Way
- 990 El Camino Way
- 991 El Camino Way
- 988 El Camino Way
- 1000 El Camino Way
- 989 El Camino Way
- 1001 El Camino Way
- 1413 Monterey Dr
- 986 El Camino Way
- 1002 El Camino Way
- 987 El Camino Way
- 1409 Monterey Dr
- 984 El Camino Way
- 1417 Monterey Dr