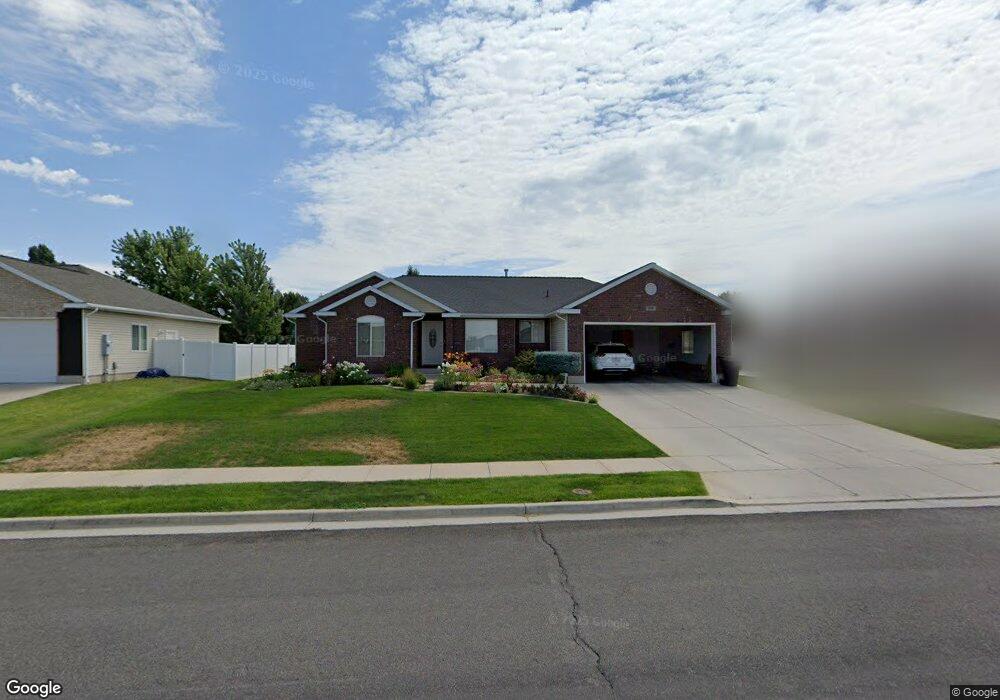
996 N 1385 W Clearfield, UT 84015
Estimated Value: $523,168 - $589,000
4
Beds
2
Baths
1,467
Sq Ft
$377/Sq Ft
Est. Value
About This Home
This home is located at 996 N 1385 W, Clearfield, UT 84015 and is currently estimated at $553,542, approximately $377 per square foot. 996 N 1385 W is a home located in Davis County with nearby schools including Clinton Elementary School, Sunset Junior High School, and Clearfield High School.
Ownership History
Date
Name
Owned For
Owner Type
Purchase Details
Closed on
Jan 22, 2024
Sold by
Olson Curtis A and Olson Jane B
Bought by
Curtis A And Jane B Olson Family Trust and Olson
Current Estimated Value
Purchase Details
Closed on
Jul 22, 2005
Sold by
Ken Mitchell Development Co Inc
Bought by
Olson Curtis A and Olson Jane B
Home Financials for this Owner
Home Financials are based on the most recent Mortgage that was taken out on this home.
Original Mortgage
$122,450
Interest Rate
5.08%
Mortgage Type
Fannie Mae Freddie Mac
Purchase Details
Closed on
Apr 22, 2005
Sold by
Kecher Dvelopment Llc
Bought by
Ken Mitchell Development Corp Inc
Home Financials for this Owner
Home Financials are based on the most recent Mortgage that was taken out on this home.
Original Mortgage
$160,440
Interest Rate
5.84%
Mortgage Type
Construction
Create a Home Valuation Report for This Property
The Home Valuation Report is an in-depth analysis detailing your home's value as well as a comparison with similar homes in the area
Home Values in the Area
Average Home Value in this Area
Purchase History
| Date | Buyer | Sale Price | Title Company |
|---|---|---|---|
| Curtis A And Jane B Olson Family Trust | -- | None Listed On Document | |
| Olson Curtis A | -- | Founders Title Co | |
| Ken Mitchell Development Corp Inc | -- | None Available |
Source: Public Records
Mortgage History
| Date | Status | Borrower | Loan Amount |
|---|---|---|---|
| Previous Owner | Olson Curtis A | $122,450 | |
| Previous Owner | Ken Mitchell Development Corp Inc | $160,440 |
Source: Public Records
Tax History Compared to Growth
Tax History
| Year | Tax Paid | Tax Assessment Tax Assessment Total Assessment is a certain percentage of the fair market value that is determined by local assessors to be the total taxable value of land and additions on the property. | Land | Improvement |
|---|---|---|---|---|
| 2025 | $2,871 | $276,100 | $93,812 | $182,288 |
| 2024 | $2,760 | $266,750 | $102,757 | $163,993 |
| 2023 | $2,617 | $468,000 | $117,547 | $350,453 |
| 2022 | $2,780 | $275,000 | $71,130 | $203,870 |
| 2021 | $2,575 | $378,000 | $90,356 | $287,644 |
| 2020 | $2,272 | $330,000 | $77,478 | $252,522 |
| 2019 | $2,234 | $317,000 | $89,243 | $227,757 |
| 2018 | $2,145 | $299,000 | $67,216 | $231,784 |
| 2016 | $1,872 | $134,750 | $31,616 | $103,134 |
| 2015 | $1,810 | $123,915 | $31,616 | $92,299 |
| 2014 | $1,812 | $125,959 | $31,616 | $94,343 |
| 2013 | -- | $112,357 | $31,020 | $81,337 |
Source: Public Records
Map
Nearby Homes
- 1122 N 1500 W
- 1242 W 1075 N
- 984 N 1100 W
- 1038 W 800 N
- 1121 N 900 W
- 1463 N 1250 W
- 1479 N 1320 W
- 563 N 1350 W Unit 139
- 1350 W 300 N Unit 49
- 1350 W 300 N Unit 38
- 1350 W 300 N Unit 29
- 620 N 1100 W
- 1337 W 550 N Unit 195
- 1827 W 775 N
- 1832 W 725 N
- 1652 W 560 N
- 575 N 1350 W Unit 137
- 1805 W 675 N
- 1197 W 1580 N
- 1132 N 780 W