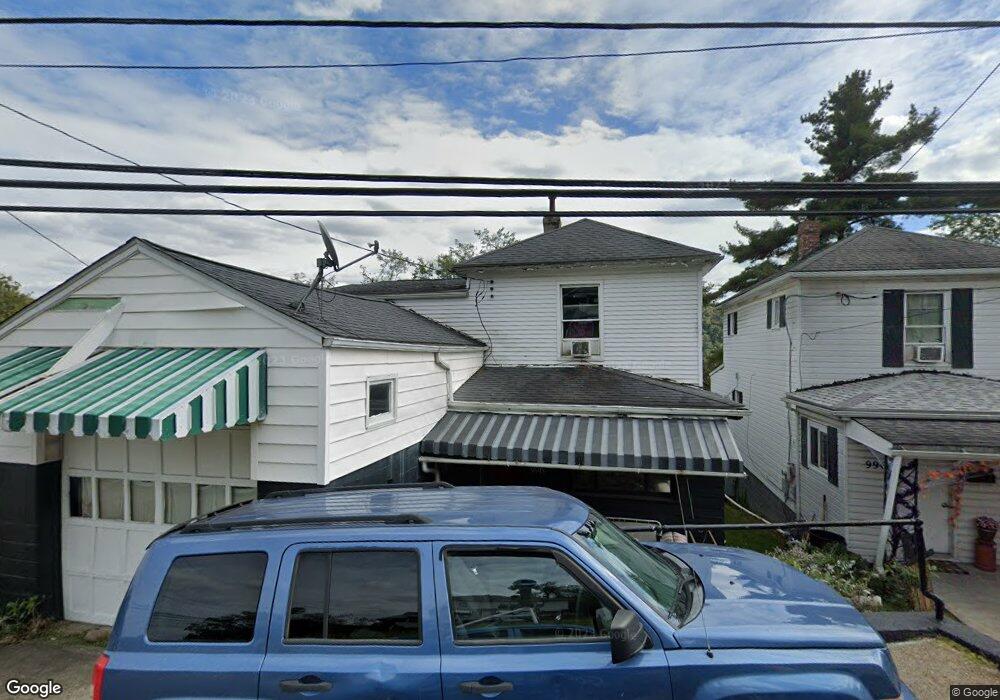
996 N 6th St Martins Ferry, OH 43935
Estimated Value: $61,000 - $101,000
3
Beds
2
Baths
1,184
Sq Ft
$69/Sq Ft
Est. Value
About This Home
This home is located at 996 N 6th St, Martins Ferry, OH 43935 and is currently estimated at $81,524, approximately $68 per square foot. 996 N 6th St is a home located in Belmont County with nearby schools including Anna Marie Ayers Elementary School, Martins Ferry Middle School, and Martins Ferry High School.
Ownership History
Date
Name
Owned For
Owner Type
Purchase Details
Closed on
Jun 14, 2021
Bought by
Tom 5 Llc
Current Estimated Value
Home Financials for this Owner
Home Financials are based on the most recent Mortgage that was taken out on this home.
Interest Rate
2.96%
Purchase Details
Closed on
May 27, 2021
Sold by
Rare Properties Inc
Bought by
Tom 5 Llc
Home Financials for this Owner
Home Financials are based on the most recent Mortgage that was taken out on this home.
Interest Rate
2.96%
Purchase Details
Closed on
Jul 25, 2014
Sold by
Summit Management Group Of Ohio Llc
Bought by
Rare Properties Inc
Purchase Details
Closed on
Feb 1, 2006
Sold by
Lesnick Rose and Lesnick Thomas
Bought by
Summit Management Group Of Ohio Llc
Purchase Details
Closed on
May 30, 2001
Bought by
Lesnick Rose and Thomas Su
Purchase Details
Closed on
Jan 1, 1986
Sold by
Lesnick Rose and Su Thomas
Bought by
Stein Rose
Create a Home Valuation Report for This Property
The Home Valuation Report is an in-depth analysis detailing your home's value as well as a comparison with similar homes in the area
Home Values in the Area
Average Home Value in this Area
Purchase History
| Date | Buyer | Sale Price | Title Company |
|---|---|---|---|
| Tom 5 Llc | $2,910,550 | -- | |
| Tom 5 Llc | $2,910,600 | Northwest Ttl Fam Of Compani | |
| Rare Properties Inc | -- | Attorney | |
| Summit Management Group Of Ohio Llc | $29,000 | None Available | |
| Lesnick Rose | -- | -- | |
| Stein Rose | -- | -- |
Source: Public Records
Mortgage History
| Date | Status | Borrower | Loan Amount |
|---|---|---|---|
| Closed | Tom 5 Llc | -- |
Source: Public Records
Tax History Compared to Growth
Tax History
| Year | Tax Paid | Tax Assessment Tax Assessment Total Assessment is a certain percentage of the fair market value that is determined by local assessors to be the total taxable value of land and additions on the property. | Land | Improvement |
|---|---|---|---|---|
| 2024 | $531 | $12,610 | $1,120 | $11,490 |
| 2023 | $622 | $13,560 | $920 | $12,640 |
| 2022 | $621 | $13,552 | $917 | $12,635 |
| 2021 | $619 | $13,552 | $917 | $12,635 |
| 2020 | $580 | $11,790 | $800 | $10,990 |
| 2019 | $612 | $11,790 | $800 | $10,990 |
| 2018 | $571 | $11,790 | $800 | $10,990 |
| 2017 | $600 | $12,030 | $740 | $11,290 |
| 2016 | $591 | $12,030 | $740 | $11,290 |
| 2015 | $534 | $12,030 | $740 | $11,290 |
| 2014 | $514 | $11,430 | $670 | $10,760 |
| 2013 | $483 | $11,430 | $670 | $10,760 |
Source: Public Records
Map
Nearby Homes