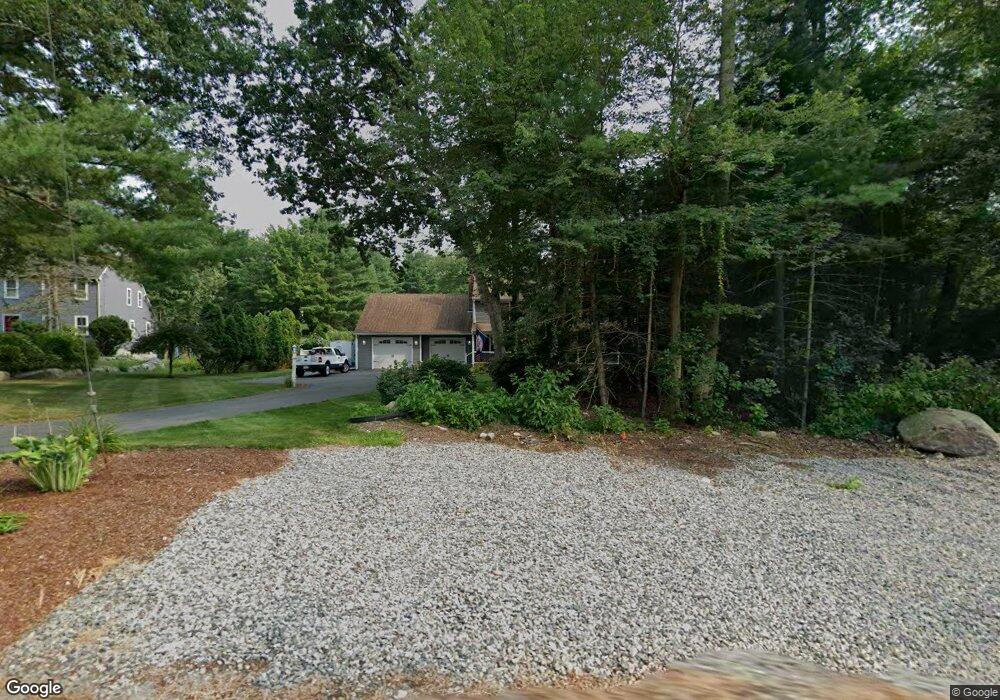
996 West St Mansfield, MA 02048
Estimated Value: $545,000 - $812,000
3
Beds
3
Baths
2,072
Sq Ft
$334/Sq Ft
Est. Value
About This Home
This home is located at 996 West St, Mansfield, MA 02048 and is currently estimated at $692,463, approximately $334 per square foot. 996 West St is a home located in Bristol County with nearby schools including Everett W. Robinson Elementary School, Jordan/Jackson Elementary School, and Harold L. Qualters Middle School.
Ownership History
Date
Name
Owned For
Owner Type
Purchase Details
Closed on
May 20, 2024
Sold by
Cahill Timothy R and Cahill Paul F
Bought by
Cahilll Ft and Cahill
Current Estimated Value
Purchase Details
Closed on
Nov 29, 1990
Sold by
Scarsciotti Joseph W
Bought by
Cahill Timothy R
Create a Home Valuation Report for This Property
The Home Valuation Report is an in-depth analysis detailing your home's value as well as a comparison with similar homes in the area
Home Values in the Area
Average Home Value in this Area
Purchase History
| Date | Buyer | Sale Price | Title Company |
|---|---|---|---|
| Cahilll Ft | -- | None Available | |
| Cahilll Ft | -- | None Available | |
| Cahill Timothy R | $131,300 | -- |
Source: Public Records
Mortgage History
| Date | Status | Borrower | Loan Amount |
|---|---|---|---|
| Previous Owner | Cahill Timothy R | $107,490 | |
| Previous Owner | Cahill Timothy R | $117,445 | |
| Previous Owner | Cahill Timothy R | $35,000 |
Source: Public Records
Tax History Compared to Growth
Tax History
| Year | Tax Paid | Tax Assessment Tax Assessment Total Assessment is a certain percentage of the fair market value that is determined by local assessors to be the total taxable value of land and additions on the property. | Land | Improvement |
|---|---|---|---|---|
| 2025 | $8,707 | $661,100 | $242,100 | $419,000 |
| 2024 | $8,041 | $595,600 | $242,100 | $353,500 |
| 2023 | $7,765 | $551,100 | $242,100 | $309,000 |
| 2022 | $7,456 | $491,500 | $224,100 | $267,400 |
| 2021 | $4,540 | $469,600 | $196,200 | $273,400 |
| 2020 | $4,372 | $453,000 | $186,800 | $266,200 |
| 2019 | $6,456 | $424,200 | $155,600 | $268,600 |
| 2018 | $4,064 | $412,200 | $148,400 | $263,800 |
| 2017 | $3,879 | $400,800 | $144,200 | $256,600 |
| 2016 | $5,615 | $364,400 | $137,300 | $227,100 |
| 2015 | $5,470 | $352,900 | $137,300 | $215,600 |
Source: Public Records
Map
Nearby Homes