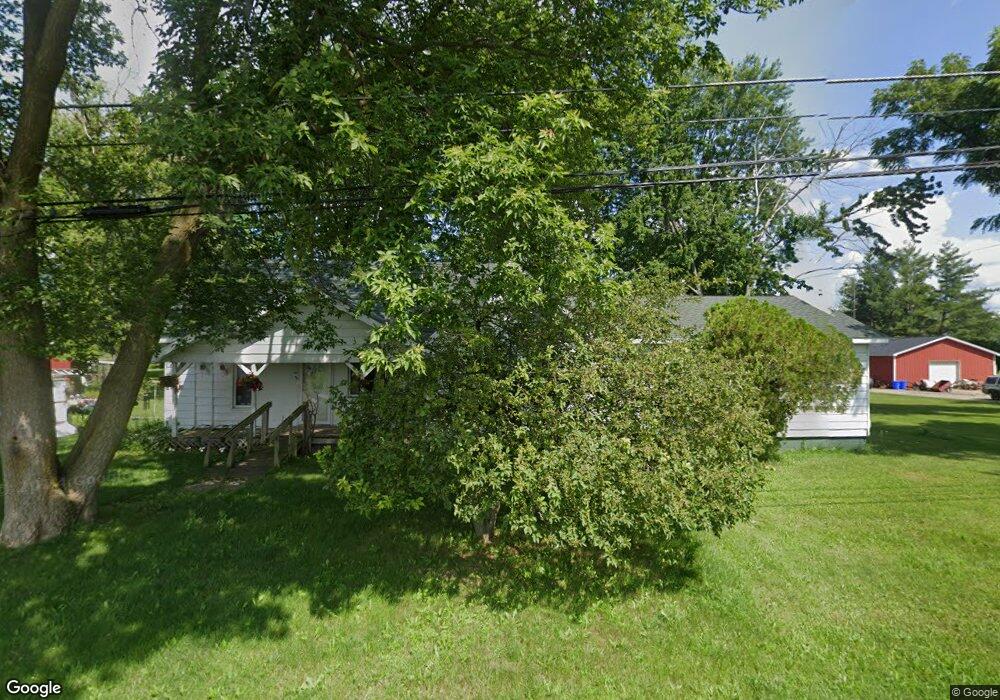
9964 Main St Clifford, MI 48727
Estimated Value: $112,000 - $193,000
4
Beds
1
Bath
1,300
Sq Ft
$113/Sq Ft
Est. Value
About This Home
This home is located at 9964 Main St, Clifford, MI 48727 and is currently estimated at $146,684, approximately $112 per square foot. 9964 Main St is a home located in Lapeer County with nearby schools including Marlette Elementary School and Marlette Junior/Senior High School.
Ownership History
Date
Name
Owned For
Owner Type
Purchase Details
Closed on
Mar 9, 2015
Sold by
Hartman Bruce W
Bought by
Havens Mark and Havens Cynthia
Current Estimated Value
Home Financials for this Owner
Home Financials are based on the most recent Mortgage that was taken out on this home.
Original Mortgage
$29,000
Interest Rate
4.32%
Mortgage Type
New Conventional
Purchase Details
Closed on
Dec 17, 2009
Sold by
Aurora Bank Fsb
Bought by
Hartman Bruce W
Purchase Details
Closed on
Nov 11, 2009
Sold by
Property Asset Management Inc
Bought by
Aurora Bank Fsb
Purchase Details
Closed on
Oct 8, 2008
Sold by
North Marvin L
Bought by
Property Asset Management Inc
Purchase Details
Closed on
Oct 25, 2006
Sold by
Blakely Blakely T T and Blakely P
Bought by
Shoup Dean
Purchase Details
Closed on
Mar 3, 2005
Sold by
Miller Shirley and Miller Cheryl
Bought by
Blakely Timothy J and Blakely Pamela I
Create a Home Valuation Report for This Property
The Home Valuation Report is an in-depth analysis detailing your home's value as well as a comparison with similar homes in the area
Home Values in the Area
Average Home Value in this Area
Purchase History
| Date | Buyer | Sale Price | Title Company |
|---|---|---|---|
| Havens Mark | $26,000 | -- | |
| Hartman Bruce W | $18,000 | -- | |
| Aurora Bank Fsb | -- | -- | |
| Property Asset Management Inc | $21,119 | -- | |
| Shoup Dean | $92,500 | -- | |
| Blakely Timothy J | -- | -- |
Source: Public Records
Mortgage History
| Date | Status | Borrower | Loan Amount |
|---|---|---|---|
| Previous Owner | Havens Mark | $29,000 |
Source: Public Records
Tax History Compared to Growth
Tax History
| Year | Tax Paid | Tax Assessment Tax Assessment Total Assessment is a certain percentage of the fair market value that is determined by local assessors to be the total taxable value of land and additions on the property. | Land | Improvement |
|---|---|---|---|---|
| 2025 | $1,472 | $49,300 | $0 | $0 |
| 2024 | $1,420 | $40,200 | $0 | $0 |
| 2023 | $327 | $38,800 | $0 | $0 |
| 2022 | $1,353 | $38,700 | $0 | $0 |
| 2021 | $1,877 | $32,900 | $0 | $0 |
| 2020 | $1,864 | $35,900 | $0 | $0 |
| 2019 | $1,268 | $30,000 | $0 | $0 |
| 2018 | $1,297 | $21,300 | $21,300 | $0 |
| 2017 | $869 | $22,200 | $0 | $0 |
| 2016 | $783 | $22,000 | $22,000 | $0 |
| 2015 | $682 | $20,200 | $0 | $0 |
| 2014 | $682 | $20,200 | $20,200 | $0 |
| 2013 | $682 | $19,700 | $19,700 | $0 |
Source: Public Records
Map
Nearby Homes
- 00 Washington St
- 4634 Marlette Rd
- 6881 S Kingston Rd
- 4470 Maitland St
- S. Kinston road S Kingston Rd
- 5872 S Kingston Rd
- 4991 Mayville Rd
- 2993 Clifford Rd
- 0000 Millington Rd
- 00 English Rd
- 4267 Clifford Rd
- 00 Murphy Lake
- 000 Hilcrest Dr
- 8674 Silverwood Unit Silverwood MI 48760
- 8674 Silverwood
- 2828 Lorraine St
- 3878 Mayville Rd
- 6946 Clifford Rd
- 3751 Clifford Rd
- 2839 Lamotte St
- 9972 Main St
- 9955 Main St
- 9955 Main St
- 9946 Main St
- 9986 Main St
- 9941 Main St
- 0 Marlette Unit 20230005765
- VL Kingston Rd
- VL Sharp Rd
- 9917 Main St
- 9917 Main St
- 9899 Main St Unit Bldg-Unit
- 9899 Main St
- 4495 Marlette Rd
- 4451 Marlette Rd
- 0 Main St Unit 4907162
- 0 Main St Unit 215049276
- 9877 Main St
- 4634 Marlette Rd
- 4634 Marlette Rd