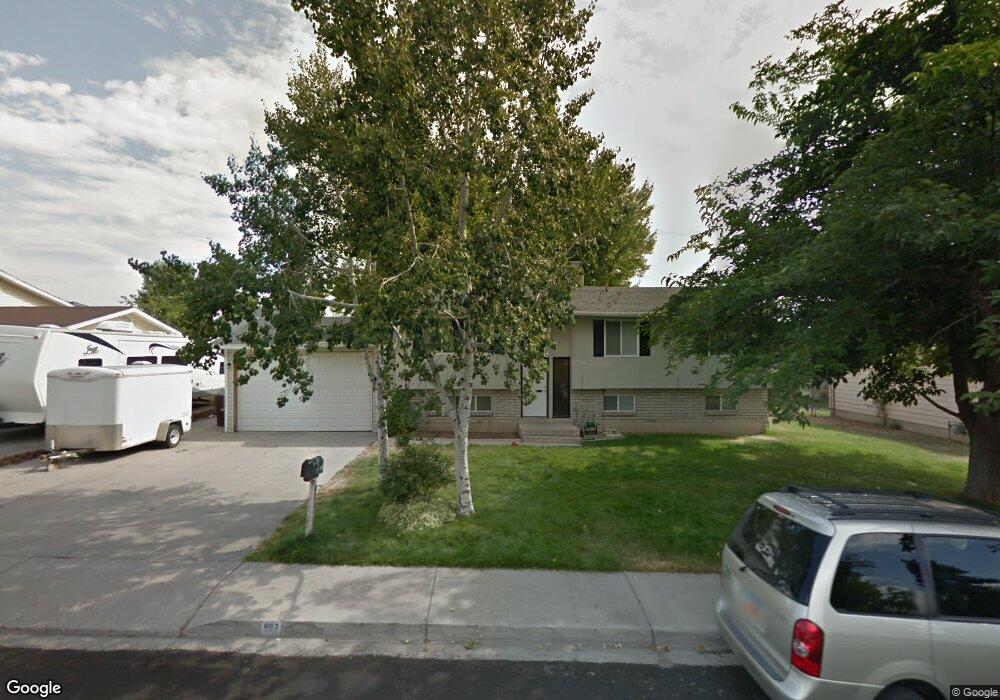
997 W 1300 N Orem, UT 84057
Bonneville NeighborhoodEstimated Value: $531,000 - $547,479
6
Beds
2
Baths
2,326
Sq Ft
$232/Sq Ft
Est. Value
About This Home
This home is located at 997 W 1300 N, Orem, UT 84057 and is currently estimated at $540,160, approximately $232 per square foot. 997 W 1300 N is a home located in Utah County with nearby schools including Bonneville Elementary School, Orem Junior High School, and Timpanogos High School.
Ownership History
Date
Name
Owned For
Owner Type
Purchase Details
Closed on
May 22, 2025
Sold by
Paul Kim A and Paul Jeanette S
Bought by
Kim And Jeanette Paul Family Trust and Paul
Current Estimated Value
Purchase Details
Closed on
Sep 30, 2015
Sold by
Paul Alan
Bought by
Paul Kim A and Paul Jeanette S
Home Financials for this Owner
Home Financials are based on the most recent Mortgage that was taken out on this home.
Original Mortgage
$211,640
Interest Rate
4.12%
Mortgage Type
FHA
Purchase Details
Closed on
May 6, 2009
Sold by
Rodriguez Juan Carlos and Rodriguez Minerva
Bought by
Paul Alan
Home Financials for this Owner
Home Financials are based on the most recent Mortgage that was taken out on this home.
Original Mortgage
$182,139
Interest Rate
4.8%
Mortgage Type
FHA
Purchase Details
Closed on
Jul 22, 2004
Sold by
Barney Kent D and Barney Linda M
Bought by
Rodriguez Juan Carlos and Rodriguez Minerva
Home Financials for this Owner
Home Financials are based on the most recent Mortgage that was taken out on this home.
Original Mortgage
$131,050
Interest Rate
6.29%
Mortgage Type
Purchase Money Mortgage
Create a Home Valuation Report for This Property
The Home Valuation Report is an in-depth analysis detailing your home's value as well as a comparison with similar homes in the area
Home Values in the Area
Average Home Value in this Area
Purchase History
| Date | Buyer | Sale Price | Title Company |
|---|---|---|---|
| Kim And Jeanette Paul Family Trust | -- | None Listed On Document | |
| Paul Kim A | -- | Meridian Title Co | |
| Paul Alan | -- | Backman | |
| Rodriguez Juan Carlos | -- | Affiliated First Title Comp |
Source: Public Records
Mortgage History
| Date | Status | Borrower | Loan Amount |
|---|---|---|---|
| Previous Owner | Paul Kim A | $211,640 | |
| Previous Owner | Paul Alan | $182,139 | |
| Previous Owner | Rodriguez Juan Carlos | $131,050 | |
| Closed | Rodriguez Juan Carlos | $24,550 |
Source: Public Records
Tax History
| Year | Tax Paid | Tax Assessment Tax Assessment Total Assessment is a certain percentage of the fair market value that is determined by local assessors to be the total taxable value of land and additions on the property. | Land | Improvement |
|---|---|---|---|---|
| 2025 | $2,088 | $273,735 | -- | -- |
| 2024 | $2,088 | $255,310 | $0 | $0 |
| 2023 | $1,945 | $255,585 | $0 | $0 |
| 2022 | $1,882 | $239,580 | $0 | $0 |
| 2021 | $1,753 | $338,000 | $151,800 | $186,200 |
| 2020 | $1,603 | $303,900 | $121,400 | $182,500 |
| 2019 | $1,421 | $280,100 | $121,400 | $158,700 |
| 2018 | $1,345 | $253,200 | $111,000 | $142,200 |
| 2017 | $1,308 | $131,945 | $0 | $0 |
| 2016 | $1,308 | $121,660 | $0 | $0 |
| 2015 | $1,208 | $106,260 | $0 | $0 |
| 2014 | $1,162 | $101,750 | $0 | $0 |
Source: Public Records
Map
Nearby Homes
- 999 W 1100 N
- 1086 N 1005 W
- 1062 N 1035 W
- 1535 N 950 W
- 1405 N 770 W
- 1123 N 800 W
- 1069 N 1160 W
- 1167 W 1550 N
- 1004 N 1090 W Unit 203
- 1499 N 1200 W Unit 8
- 967 W 1630 N
- 930 N 980 W
- 1140 W 950 N Unit D302
- 1140 W 950 N Unit D304
- 582 W 1300 N
- 545 W 1240 N
- 531 W 1350 N
- 538 W 1120 N
- 1545 N State St Unit 1
- 651 W 1800 N
Your Personal Tour Guide
Ask me questions while you tour the home.