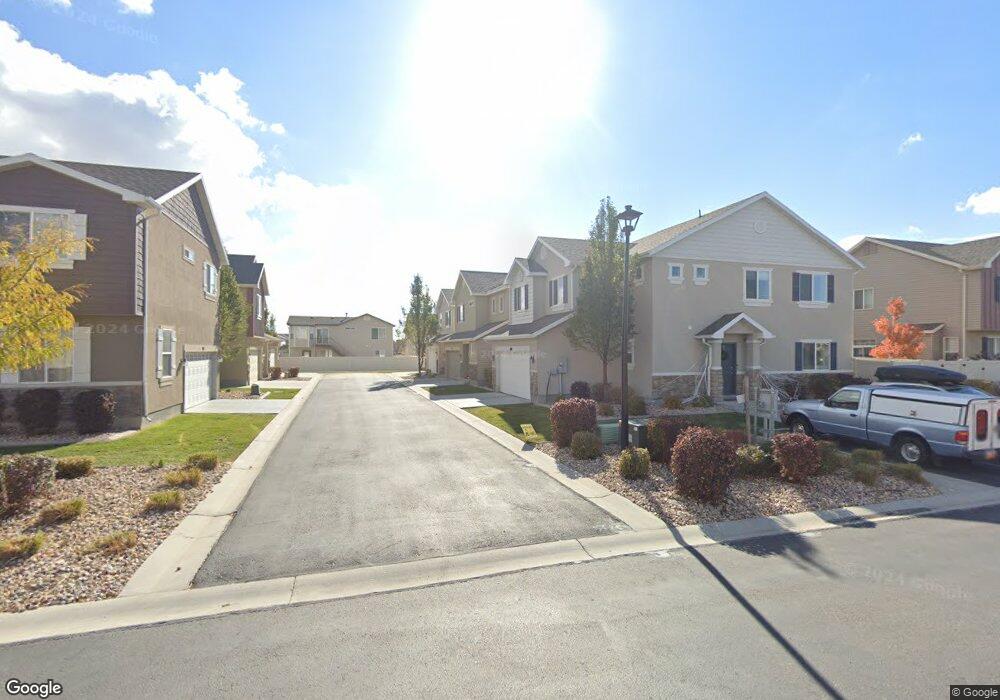
997 W Stonehaven Dr North Salt Lake, UT 84054
Estimated Value: $459,000 - $508,000
3
Beds
3
Baths
1,481
Sq Ft
$328/Sq Ft
Est. Value
About This Home
This home is located at 997 W Stonehaven Dr, North Salt Lake, UT 84054 and is currently estimated at $485,654, approximately $327 per square foot. 997 W Stonehaven Dr is a home located in Davis County with nearby schools including Foxboro School, Mueller Park Junior High School, and Bountiful High School.
Ownership History
Date
Name
Owned For
Owner Type
Purchase Details
Closed on
Jul 15, 2020
Sold by
Hepworth Zayda A
Bought by
Hepworth Zayda A and Hepworth Clifton P
Current Estimated Value
Home Financials for this Owner
Home Financials are based on the most recent Mortgage that was taken out on this home.
Original Mortgage
$228,200
Outstanding Balance
$201,901
Interest Rate
3.1%
Mortgage Type
New Conventional
Estimated Equity
$283,753
Purchase Details
Closed on
Mar 4, 2020
Sold by
Hepworth Davis G
Bought by
Hepworth Tyra
Purchase Details
Closed on
Dec 1, 2017
Sold by
Worsley Chad P
Bought by
Hepworth Davis G
Home Financials for this Owner
Home Financials are based on the most recent Mortgage that was taken out on this home.
Original Mortgage
$182,000
Interest Rate
3.88%
Mortgage Type
New Conventional
Create a Home Valuation Report for This Property
The Home Valuation Report is an in-depth analysis detailing your home's value as well as a comparison with similar homes in the area
Home Values in the Area
Average Home Value in this Area
Purchase History
| Date | Buyer | Sale Price | Title Company |
|---|---|---|---|
| Hepworth Zayda A | -- | First American Title Ins Co | |
| Hepworth Zayda A | -- | First American Title Ins Co | |
| Hepworth Tyra | -- | Accommodation | |
| Hepworth Davis G | -- | Security Title |
Source: Public Records
Mortgage History
| Date | Status | Borrower | Loan Amount |
|---|---|---|---|
| Open | Hepworth Zayda A | $228,200 | |
| Closed | Hepworth Davis G | $182,000 |
Source: Public Records
Tax History Compared to Growth
Tax History
| Year | Tax Paid | Tax Assessment Tax Assessment Total Assessment is a certain percentage of the fair market value that is determined by local assessors to be the total taxable value of land and additions on the property. | Land | Improvement |
|---|---|---|---|---|
| 2025 | $2,378 | $249,700 | $83,613 | $166,087 |
| 2024 | $2,378 | $239,250 | $84,383 | $154,867 |
| 2023 | $2,161 | $393,000 | $107,839 | $285,161 |
| 2022 | $2,264 | $226,050 | $47,103 | $178,947 |
| 2021 | $2,244 | $340,000 | $64,935 | $275,065 |
| 2020 | $2,304 | $307,000 | $55,567 | $251,433 |
| 2019 | $2,209 | $298,000 | $52,632 | $245,368 |
| 2018 | $1,798 | $252,000 | $47,848 | $204,152 |
| 2016 | $1,503 | $115,555 | $26,316 | $89,239 |
| 2015 | $648 | $47,848 | $47,848 | $0 |
| 2014 | $636 | $47,848 | $47,848 | $0 |
Source: Public Records
Map
Nearby Homes
- 1002 W Stonehaven Dr Unit 108
- 940 W Stonehaven Dr
- 1072 W Stonehaven Dr
- 920 W Stonehaven Dr
- 997 N Fox Hollow Dr
- 954 N Picadilly Ct
- 928 Amberly Dr
- 967 Amberly Dr
- 715 Leeds Ct
- 979 Amberly Dr
- 1127 W Haworth Dr
- 741 N Skipton Dr
- 942 N Abbey Dr
- 1052 Chidester Dr
- 997 Amberly Dr
- 114 Birmingham Ln
- 1147 Ethnie Ct
- 452 N Kent Ln
- 433 Kent Dr
- 448 Kent Dr
- 999 W Stonehaven Dr
- 1007 W Stonehaven Dr
- 1002 York Dr
- 1005 W Stonehaven Dr
- 993 W Stonehaven Dr
- 1001 W Stonehaven Dr
- 996 York Dr
- 991 W Stonehaven Dr
- 1003 W Stonehaven Dr
- 989 W Stonehaven Dr
- 1008 York Dr
- 990 York Dr
- 1012 York Dr
- 1011 W Stonehaven Dr
- 983 W Stonehaven Dr
- 1013 W Stonehaven Dr
- 981 W Stonehaven Dr
- 1015 W Stonehaven Dr
- 1018 York Dr
- 985 W Stonehaven Dr