Estimated Value: $409,000 - $442,000
3
Beds
3
Baths
1,352
Sq Ft
$314/Sq Ft
Est. Value
About This Home
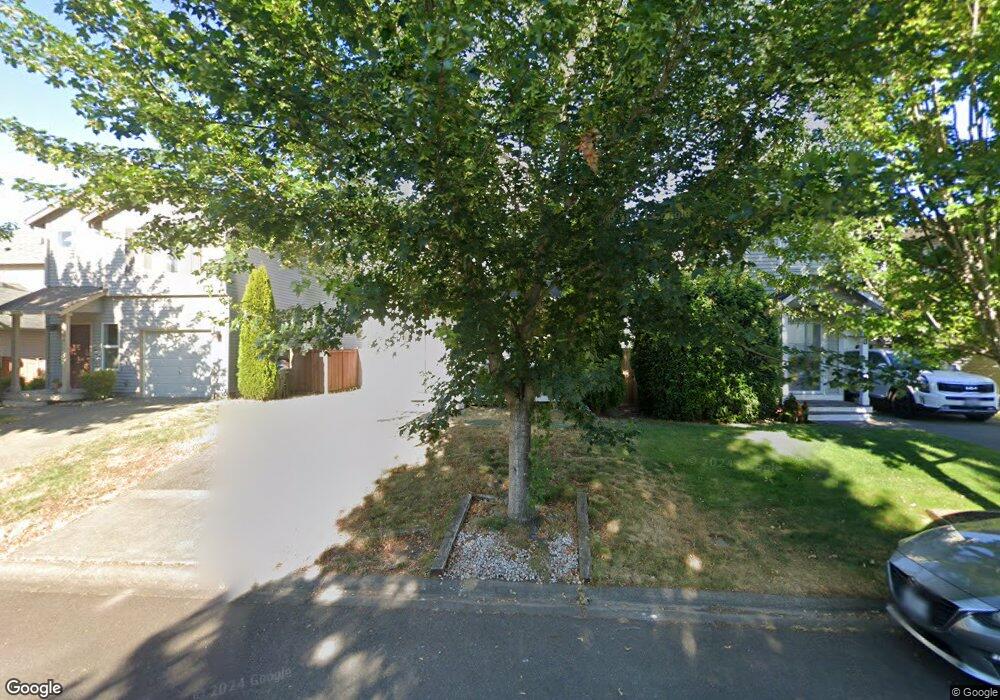
This home is located at 9972 Dragt St, Yelm, WA 98597 and is currently estimated at $424,431, approximately $313 per square foot. 9972 Dragt St is a home located in Thurston County with nearby schools including Southworth Elementary School, Yelm Middle School, and Yelm High School.
Ownership History
Date
Name
Owned For
Owner Type
Purchase Details
Closed on
Mar 4, 2022
Sold by
Gamble Brianna L and Gamble Zachary A
Bought by
Mckinniss Zachary A
Current Estimated Value
Home Financials for this Owner
Home Financials are based on the most recent Mortgage that was taken out on this home.
Original Mortgage
$403,062
Outstanding Balance
$375,601
Interest Rate
3.69%
Mortgage Type
VA
Estimated Equity
$48,830
Purchase Details
Closed on
May 14, 2010
Sold by
The Quadrant Corporation
Bought by
Johnson Michael P and Johnson Kateryna
Home Financials for this Owner
Home Financials are based on the most recent Mortgage that was taken out on this home.
Original Mortgage
$191,200
Interest Rate
5.21%
Mortgage Type
VA
Purchase Details
Closed on
Feb 6, 2008
Sold by
Ttph 1 2 Llc
Bought by
The Quadrant Corp
Create a Home Valuation Report for This Property
The Home Valuation Report is an in-depth analysis detailing your home's value as well as a comparison with similar homes in the area
Home Values in the Area
Average Home Value in this Area
Purchase History
| Date | Buyer | Sale Price | Title Company |
|---|---|---|---|
| Mckinniss Zachary A | -- | Rainier Title Company | |
| Mckinniss Zachary A | $394,000 | New Title Company Name | |
| Johnson Michael P | $160,907 | First American Title | |
| The Quadrant Corp | $240,000 | First American Title |
Source: Public Records
Mortgage History
| Date | Status | Borrower | Loan Amount |
|---|---|---|---|
| Open | Mckinniss Zachary A | $403,062 | |
| Previous Owner | Johnson Michael P | $191,200 |
Source: Public Records
Tax History Compared to Growth
Tax History
| Year | Tax Paid | Tax Assessment Tax Assessment Total Assessment is a certain percentage of the fair market value that is determined by local assessors to be the total taxable value of land and additions on the property. | Land | Improvement |
|---|---|---|---|---|
| 2024 | $3,263 | $346,800 | $69,900 | $276,900 |
| 2023 | $3,263 | $334,100 | $54,800 | $279,300 |
| 2022 | $2,741 | $340,700 | $38,400 | $302,300 |
| 2021 | $2,579 | $248,700 | $37,900 | $210,800 |
| 2020 | $2,590 | $203,400 | $25,500 | $177,900 |
| 2019 | $1,850 | $199,600 | $34,300 | $165,300 |
| 2018 | $1,950 | $143,700 | $16,500 | $127,200 |
| 2017 | $1,849 | $142,700 | $17,400 | $125,300 |
| 2016 | $1,772 | $137,100 | $24,900 | $112,200 |
| 2014 | -- | $129,000 | $24,400 | $104,600 |
Source: Public Records
Map
Nearby Homes
- 14854 99th Way SE
- 9917 Dragt St SE
- 14702 Terra View St SE
- 14912 99th Way SE
- 14944 100th Ave SE
- 14942 99th Way SE
- 14933 Terra View St SE
- 14944 Terra View St SE
- 10071 Jensen Dr SE
- 9945 Justman St SE
- 14447 98th Way SE
- 14426 99th Ave SE
- 14420 99th Ave SE
- 14396 99th Ave SE
- 108 Washington Ct SE
- 9990 Merrick St SE Unit 348
- 14216 Jensen Dr SE Unit 355
- 9878 Merrick St SE Unit 333
- 9959 Merrick St SE Unit 374
- 9967 Merrick St SE Unit 373