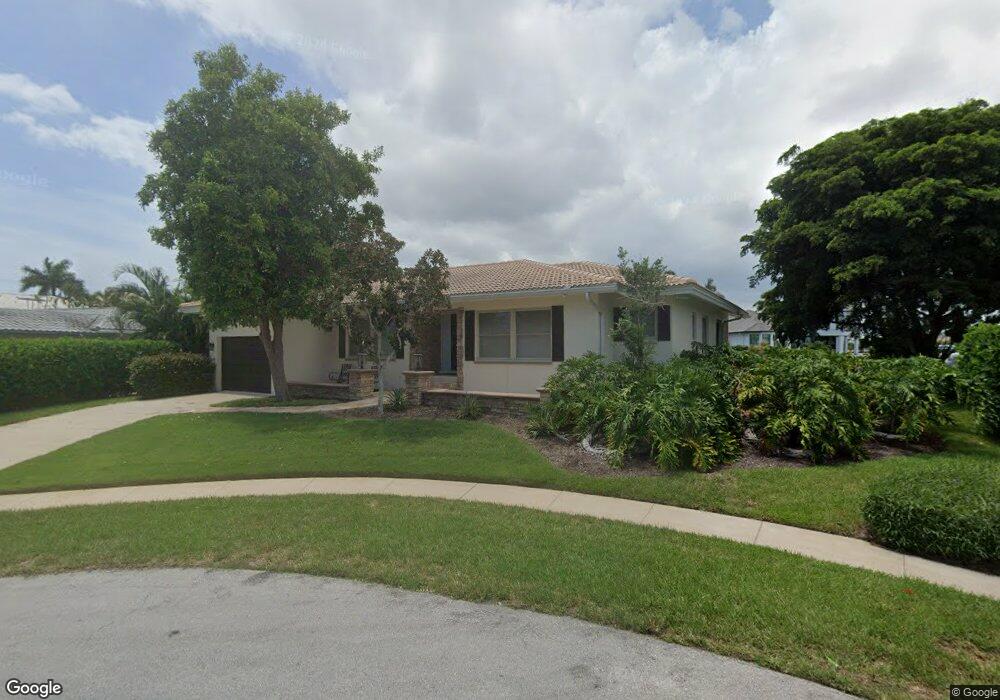
998 Aster Ct Marco Island, FL 34145
Estimated Value: $1,018,301 - $1,335,000
--
Bed
--
Bath
1,729
Sq Ft
$702/Sq Ft
Est. Value
About This Home
This home is located at 998 Aster Ct, Marco Island, FL 34145 and is currently estimated at $1,213,325, approximately $701 per square foot. 998 Aster Ct is a home located in Collier County with nearby schools including Tommie Barfield Elementary School, Manatee Middle School, and Lely High School.
Ownership History
Date
Name
Owned For
Owner Type
Purchase Details
Closed on
May 20, 2022
Sold by
Sonesen Daniel A
Bought by
Daniel And Camille Sonesen Revocable Joint Tr
Current Estimated Value
Purchase Details
Closed on
Mar 21, 1994
Sold by
Kohan Michael B and Kohan Lisa A
Bought by
Sonesen Daniel A and Sonesen Camille
Home Financials for this Owner
Home Financials are based on the most recent Mortgage that was taken out on this home.
Original Mortgage
$117,000
Interest Rate
7.1%
Create a Home Valuation Report for This Property
The Home Valuation Report is an in-depth analysis detailing your home's value as well as a comparison with similar homes in the area
Home Values in the Area
Average Home Value in this Area
Purchase History
| Date | Buyer | Sale Price | Title Company |
|---|---|---|---|
| Daniel And Camille Sonesen Revocable Joint Tr | -- | Snyder & Snyder Pa | |
| Sonesen Daniel A | $230,000 | -- |
Source: Public Records
Mortgage History
| Date | Status | Borrower | Loan Amount |
|---|---|---|---|
| Previous Owner | Sonesen Daniel A | $117,000 |
Source: Public Records
Tax History Compared to Growth
Tax History
| Year | Tax Paid | Tax Assessment Tax Assessment Total Assessment is a certain percentage of the fair market value that is determined by local assessors to be the total taxable value of land and additions on the property. | Land | Improvement |
|---|---|---|---|---|
| 2025 | $3,032 | $357,491 | -- | -- |
| 2024 | $3,009 | $347,416 | -- | -- |
| 2023 | $3,009 | $337,297 | $0 | $0 |
| 2022 | $3,156 | $327,473 | $0 | $0 |
| 2021 | $3,248 | $317,935 | $0 | $0 |
| 2020 | $3,184 | $313,545 | $0 | $0 |
| 2019 | $3,157 | $306,496 | $0 | $0 |
| 2018 | $3,096 | $300,781 | $0 | $0 |
| 2017 | $3,059 | $294,595 | $0 | $0 |
| 2016 | $3,012 | $288,536 | $0 | $0 |
| 2015 | $3,069 | $286,530 | $0 | $0 |
| 2014 | $3,071 | $234,256 | $0 | $0 |
Source: Public Records
Map
Nearby Homes