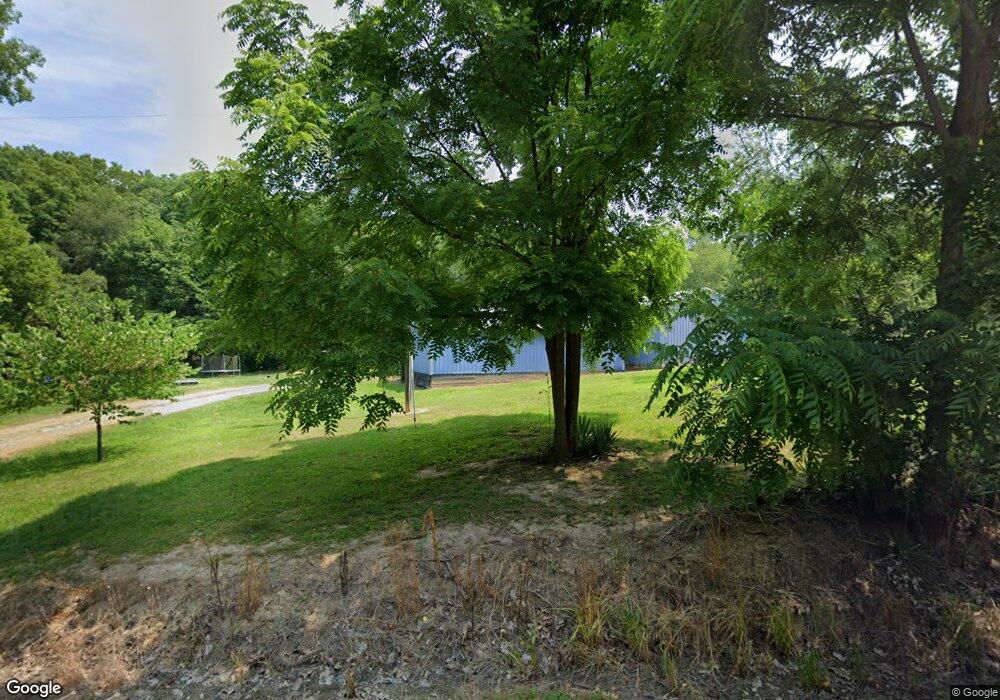
998 Conaway Rd Peebles, OH 45660
Estimated Value: $164,000 - $283,000
4
Beds
1
Bath
1,248
Sq Ft
$173/Sq Ft
Est. Value
About This Home
This home is located at 998 Conaway Rd, Peebles, OH 45660 and is currently estimated at $215,987, approximately $173 per square foot. 998 Conaway Rd is a home located in Adams County with nearby schools including Peebles Elementary School and Peebles High School.
Ownership History
Date
Name
Owned For
Owner Type
Purchase Details
Closed on
Jan 17, 2023
Sold by
Smith Family Revocable Trust
Bought by
Smith David
Current Estimated Value
Purchase Details
Closed on
Nov 16, 2021
Sold by
Henry Smith William
Bought by
Smith Family Revocable Trust
Purchase Details
Closed on
Nov 26, 2014
Sold by
Smith William Henry and Smith Carol Ann
Bought by
Smith Revocable Living Trust
Purchase Details
Closed on
Oct 4, 2011
Sold by
Fannie Mae
Bought by
Smith William H and Smith Carol A
Purchase Details
Closed on
May 6, 2011
Sold by
Rose Jacob P
Bought by
Federal National Mortgage Association
Purchase Details
Closed on
Jan 1, 1990
Bought by
Mcquinn Robert S
Create a Home Valuation Report for This Property
The Home Valuation Report is an in-depth analysis detailing your home's value as well as a comparison with similar homes in the area
Purchase History
| Date | Buyer | Sale Price | Title Company |
|---|---|---|---|
| Smith David | -- | -- | |
| Smith Family Revocable Trust | -- | -- | |
| Smith Revocable Living Trust | -- | None Available | |
| Smith William H | $35,000 | None Available | |
| Federal National Mortgage Association | $50,000 | None Available | |
| Mcquinn Robert S | -- | -- |
Source: Public Records
Tax History
| Year | Tax Paid | Tax Assessment Tax Assessment Total Assessment is a certain percentage of the fair market value that is determined by local assessors to be the total taxable value of land and additions on the property. | Land | Improvement |
|---|---|---|---|---|
| 2025 | $1,438 | $49,600 | $15,120 | $34,480 |
| 2024 | $1,438 | $49,600 | $15,120 | $34,480 |
| 2023 | $1,512 | $49,600 | $15,120 | $34,480 |
| 2022 | $1,418 | $38,860 | $10,750 | $28,110 |
| 2021 | $1,264 | $38,860 | $10,750 | $28,110 |
| 2020 | $1,290 | $38,860 | $10,750 | $28,110 |
| 2019 | $1,290 | $38,860 | $10,750 | $28,110 |
| 2018 | $1,090 | $35,180 | $10,750 | $24,430 |
| 2017 | $1,074 | $35,180 | $10,750 | $24,430 |
| 2016 | $1,065 | $35,180 | $10,750 | $24,430 |
| 2015 | $1,010 | $31,540 | $7,390 | $24,150 |
| 2014 | $998 | $31,540 | $7,390 | $24,150 |
Source: Public Records
Map
Nearby Homes
- 31648 State Route 41
- 41 Acres Sr 41
- 250 Poplar Grove Rd
- 2090 Dutch Thomas Rd
- 1 Seaman Rd
- 16 Black Hollow Rd
- 154 Black Hollow Rd
- 1056 Nace Corner Rd
- 135 Union Hill Rd
- 0 S Unit Chenoweth Fork Rd
- 0 S Side Chenoweth Fork Rd
- 630 Dawn Ln
- 9 Sugar St
- 664 Strait Creek Rd
- 13731 Saw Mill Rd
- 3750 Ohio 124
- 18 Church St
- 173 Elm St
- 136 N Main St
- 17 S Nixon Ave
- 999 Conaway Rd
- 1160 Conaway Rd
- 10ac Mccoy Rd
- 0 E St Rt 781 Unit 1808194
- 14.04 ac Flat Run Rd
- 23.29 ac Flat Run Rd
- 89 & 94 N Main St
- 0 Stewart Hollow Rd Unit 1764189
- 0 Monterey Dr Unit 1757111
- 20231 State Route 41
- 0 Stewart Hollow Rd Unit 1752566
- 123 Magee Jones Rd
- 23 Old Sr 32
- 5947 Oh 73
- 28.67ac Mccoy Rd
- McCoy Rd Lot Unit Wp001
- 1606 Conaway Rd
- 63.6ac Mccoy Rd
- 4.5233ac Conaway Rd
- 123 !Dnp Test
Your Personal Tour Guide
Ask me questions while you tour the home.