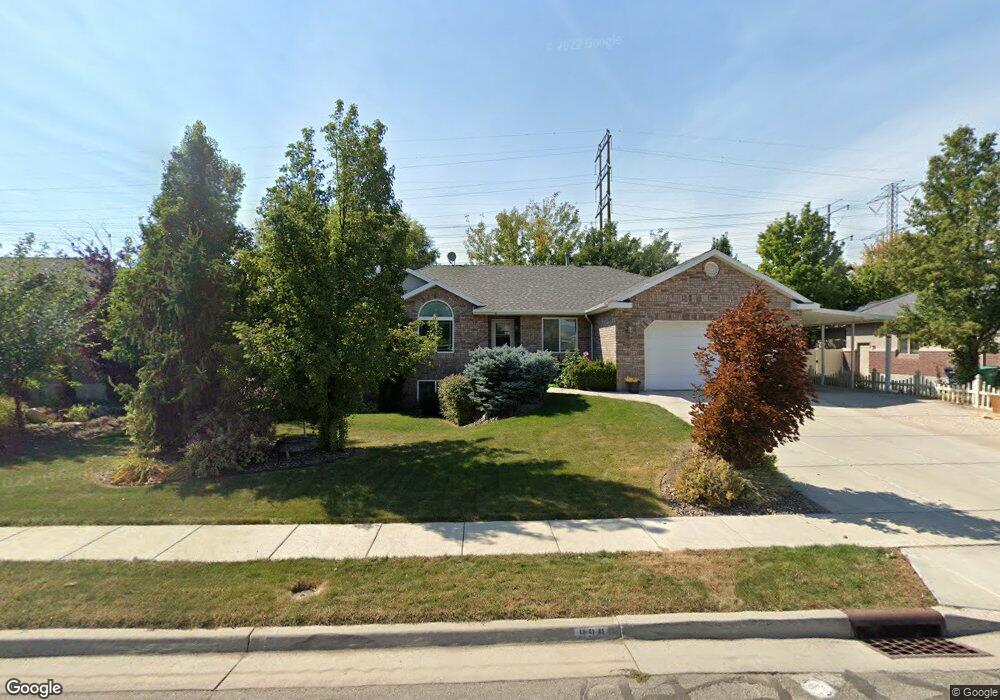
998 S Bridge Creek Ln W Layton, UT 84041
Estimated Value: $714,000 - $735,000
3
Beds
3
Baths
3,440
Sq Ft
$211/Sq Ft
Est. Value
About This Home
This home is located at 998 S Bridge Creek Ln W, Layton, UT 84041 and is currently estimated at $725,469, approximately $210 per square foot. 998 S Bridge Creek Ln W is a home located in Davis County with nearby schools including Heritage Elementary School, Shoreline Junior High School, and Layton High School.
Ownership History
Date
Name
Owned For
Owner Type
Purchase Details
Closed on
May 12, 2021
Sold by
Mecham David Wooley and Mecham Nanette Neville
Bought by
Mecham David W and Mecham Nanette N
Current Estimated Value
Purchase Details
Closed on
Apr 30, 2021
Sold by
Neville Donald and Neville Donald
Bought by
Mecham David Wooley and Mecham Nanette Neville
Purchase Details
Closed on
Nov 28, 2018
Sold by
Neville Donald and The Donald And Margery Neville
Bought by
Neville Donald and The Donald And Margery Neville
Purchase Details
Closed on
Jun 21, 2005
Sold by
Law Brent
Bought by
Gillespie Rex M and Gillespie Lorna D
Home Financials for this Owner
Home Financials are based on the most recent Mortgage that was taken out on this home.
Original Mortgage
$260,935
Interest Rate
5.72%
Mortgage Type
VA
Purchase Details
Closed on
Jun 16, 2004
Sold by
Ed Green Development Llc
Bought by
Law Brent
Create a Home Valuation Report for This Property
The Home Valuation Report is an in-depth analysis detailing your home's value as well as a comparison with similar homes in the area
Home Values in the Area
Average Home Value in this Area
Purchase History
| Date | Buyer | Sale Price | Title Company |
|---|---|---|---|
| Mecham David W | -- | Hickman Land Title C | |
| Mecham David Wooley | -- | Hickman Land Title Co | |
| Neville Donald | -- | Accommodation | |
| Gillespie Rex M | -- | Founders Title Co | |
| Law Brent | -- | Security Title Company |
Source: Public Records
Mortgage History
| Date | Status | Borrower | Loan Amount |
|---|---|---|---|
| Previous Owner | Gillespie Rex M | $260,935 |
Source: Public Records
Tax History Compared to Growth
Tax History
| Year | Tax Paid | Tax Assessment Tax Assessment Total Assessment is a certain percentage of the fair market value that is determined by local assessors to be the total taxable value of land and additions on the property. | Land | Improvement |
|---|---|---|---|---|
| 2025 | $374 | $363,550 | $112,909 | $250,641 |
| 2024 | $40 | $342,651 | $120,742 | $221,909 |
| 2023 | $3,192 | $595,000 | $127,940 | $467,060 |
| 2022 | $3,331 | $337,150 | $74,315 | $262,835 |
| 2021 | $606 | $465,000 | $111,455 | $353,545 |
| 2020 | $2,783 | $403,000 | $95,271 | $307,729 |
| 2019 | $2,665 | $378,000 | $94,082 | $283,918 |
| 2018 | $2,472 | $352,000 | $82,919 | $269,081 |
| 2016 | $2,275 | $167,090 | $40,548 | $126,542 |
| 2015 | $2,290 | $159,665 | $40,548 | $119,117 |
| 2014 | $2,359 | $168,210 | $40,548 | $127,662 |
| 2013 | -- | $160,205 | $38,319 | $121,886 |
Source: Public Records
Map
Nearby Homes
- 796 S Rock Creek Corner
- 920 S 1700 W Unit 1
- 1124 S Neville St
- 1278 S Grace Way
- 1234 S Grace Way
- Creighton Farmhouse Plan at Angel Hill
- 1494 S Mica Ln
- 583 S Alberta Spruce Dr
- 557 S Angel St
- 1038 S Old Towne Rd
- 2182 W Evergreen Way Unit 143
- 2056 W Phillips St
- 774 W Farming Way
- 233 Heathermoor Ln
- Aspen Plan at West Gate
- Eleanor Plan at West Gate
- McKinley Plan at West Gate
- Harrison Plan at West Gate
- Redwood Plan at West Gate
- Alpine - WG Plan at West Gate
- 998 Bridgecreek Ln
- 974 Bridgecreek Ln
- 1010 Bridgecreek Ln
- 972 Bridgecreek Ln
- 1572 W 975 S
- 1565 W 975 S
- 1014 S Bridge Creek Ln W
- 1014 Bridgecreek Ln
- 1549 W 975 S
- 958 Bridgecreek Ln
- 958 S Bridge Creek Ln W
- 1556 W 975 S
- 1022 S Bridge Creek Ln W
- 1522 W 1025 S
- 1022 Bridgecreek Ln
- 1605 W Timbercreek Ln
- 946 Bridgecreek Ln
- 1518 W 1025 S
- 1052 Bridgecreek Ln
- 1591 W Timbercreek Ln