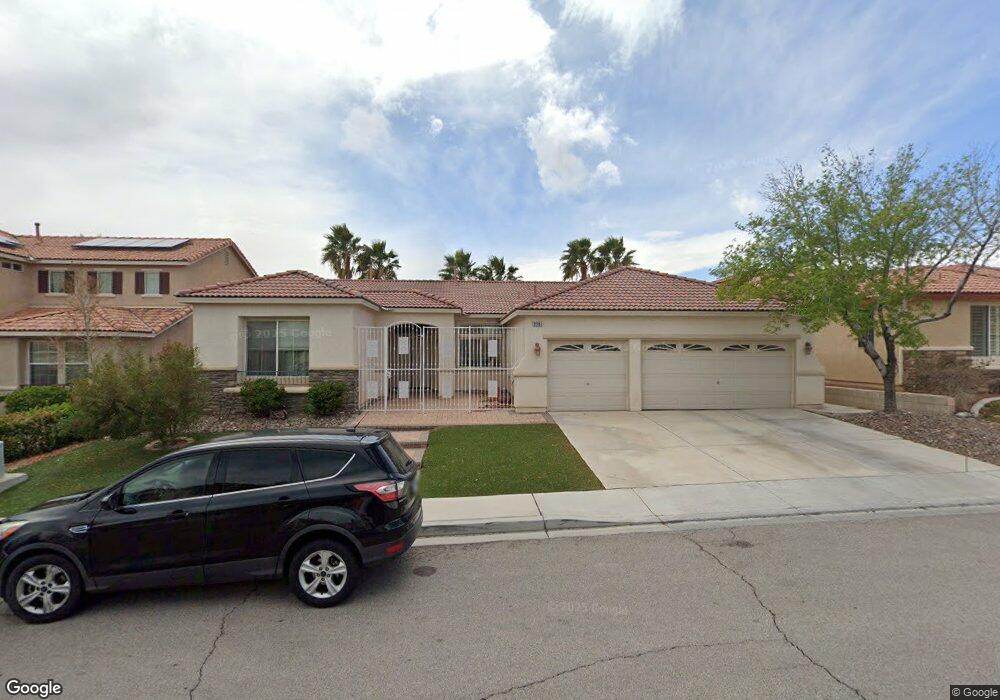
9981 Shady Glade Ct Unit 1 Las Vegas, NV 89148
Estimated Value: $620,842
3
Beds
3
Baths
2,443
Sq Ft
$254/Sq Ft
Est. Value
About This Home
This home is located at 9981 Shady Glade Ct Unit 1, Las Vegas, NV 89148 and is currently priced at $620,842, approximately $254 per square foot. 9981 Shady Glade Ct Unit 1 is a home located in Clark County with nearby schools including Sandra B Abston Elementary School, Victoria Fertitta Middle School, and Durango High School.
Ownership History
Date
Name
Owned For
Owner Type
Purchase Details
Closed on
Feb 26, 2021
Sold by
Wang Lawrence
Bought by
Yuan Yibin
Current Estimated Value
Purchase Details
Closed on
Apr 23, 2009
Sold by
Wang Lawrence
Bought by
Yuan Yibin
Home Financials for this Owner
Home Financials are based on the most recent Mortgage that was taken out on this home.
Original Mortgage
$216,000
Outstanding Balance
$134,480
Interest Rate
4.82%
Mortgage Type
Unknown
Purchase Details
Closed on
Oct 24, 2002
Sold by
Pardee Homes Of Nevada
Bought by
Yuan Yibin
Home Financials for this Owner
Home Financials are based on the most recent Mortgage that was taken out on this home.
Original Mortgage
$197,150
Interest Rate
6.09%
Create a Home Valuation Report for This Property
The Home Valuation Report is an in-depth analysis detailing your home's value as well as a comparison with similar homes in the area
Home Values in the Area
Average Home Value in this Area
Purchase History
| Date | Buyer | Sale Price | Title Company |
|---|---|---|---|
| Yuan Yibin | -- | Lawyers Title Chinatown L | |
| Yuan Yibin | -- | Noble Title | |
| Yuan Yibin | -- | Noble Title | |
| Yuan Yibin | $246,486 | National Title Company |
Source: Public Records
Mortgage History
| Date | Status | Borrower | Loan Amount |
|---|---|---|---|
| Open | Yuan Yibin | $216,000 | |
| Previous Owner | Yuan Yibin | $197,150 |
Source: Public Records
Tax History Compared to Growth
Tax History
| Year | Tax Paid | Tax Assessment Tax Assessment Total Assessment is a certain percentage of the fair market value that is determined by local assessors to be the total taxable value of land and additions on the property. | Land | Improvement |
|---|---|---|---|---|
| 2025 | $3,205 | $161,086 | $54,950 | $106,136 |
| 2024 | $2,968 | $161,086 | $54,950 | $106,136 |
| 2023 | $2,968 | $147,738 | $47,250 | $100,488 |
| 2022 | $2,748 | $132,524 | $40,950 | $91,574 |
| 2021 | $2,545 | $122,861 | $35,700 | $87,161 |
| 2020 | $2,360 | $120,561 | $34,300 | $86,261 |
| 2019 | $2,212 | $114,502 | $29,750 | $84,752 |
| 2018 | $2,111 | $106,742 | $25,200 | $81,542 |
| 2017 | $3,153 | $107,491 | $24,850 | $82,641 |
| 2016 | $1,976 | $94,933 | $21,000 | $73,933 |
| 2015 | $1,972 | $96,339 | $15,400 | $80,939 |
| 2014 | $1,915 | $63,326 | $13,300 | $50,026 |
Source: Public Records
Map
Nearby Homes
- 10017 Twilight Vista Ave
- 5349 Misty Acres Ct
- 5387 S Conquistador St
- 9927 Ridge Manor Ave
- 9862 Shadow Grove Ave
- 9792 Sonora Bend Ave
- 9821 Sedona Shrine Ave
- 10033 Flagstaff Butte Ave
- 5233 Fiery Sky Ridge St
- 5140 Fiery Sky Ridge St
- 10109 Whitney Falls Ct
- 5084 Thunder River Cir
- 5389 Progresso St
- 5076 Thunder River Cir
- 9687 Ridgebluff Ave
- 9693 Bighorn Island Ave
- 10243 Cantiamo Ct
- 10139 White Mulberry Dr
- 10286 Rio de Thule Ln
- 5014 Thunder River Cir
- 9981 Shady Glade Ct
- 9973 Shady Glade Ct
- 9989 Shady Glade Ct
- 9965 Shady Glade Ct
- 9997 Shady Glade Ct
- 9980 Shady Glade Ct
- 9972 Shady Glade Ct Unit na
- 9972 Shady Glade Ct
- 9988 Shady Glade Ct
- 9974 Ridgehaven Ave
- 9966 Ridgehaven Ave
- 9957 Shady Glade Ct
- 9964 Shady Glade Ct
- 9980 Ridgehaven Ave
- 5302 S Conquistador St
- 9958 Ridgehaven Ave
- 9996 Shady Glade Ct
- 9952 Ridgehaven Ave
- 9956 Shady Glade Ct
- 5310 S Conquistador St