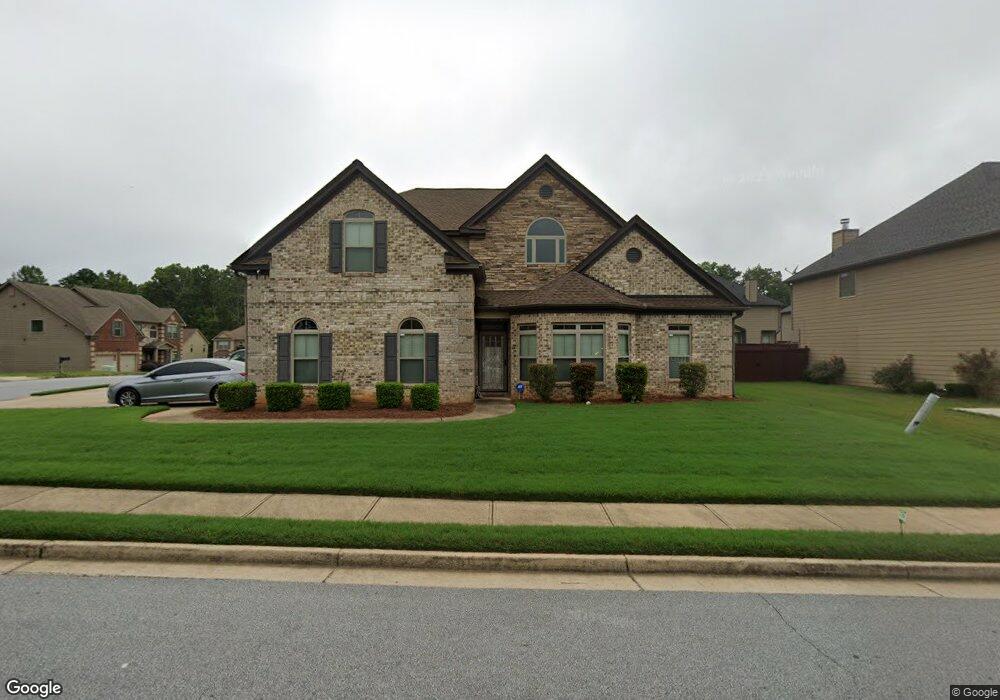
9985 Chappell Ln Unit LOT 96 Jonesboro, GA 30238
Estimated Value: $354,000 - $371,782
4
Beds
4
Baths
2,920
Sq Ft
$124/Sq Ft
Est. Value
About This Home
This home is located at 9985 Chappell Ln Unit LOT 96, Jonesboro, GA 30238 and is currently estimated at $362,891, approximately $124 per square foot. 9985 Chappell Ln Unit LOT 96 is a home located in Clayton County with nearby schools including Kemp Primary School, Kemp Elementary School, and Mundys Mill Middle School.
Ownership History
Date
Name
Owned For
Owner Type
Purchase Details
Closed on
Sep 28, 2017
Sold by
Adams Cherrie
Bought by
Adams Cherrie and Adams Osric
Current Estimated Value
Purchase Details
Closed on
May 5, 2015
Sold by
Bolton Marcus D
Bought by
Adams Cherrie
Home Financials for this Owner
Home Financials are based on the most recent Mortgage that was taken out on this home.
Original Mortgage
$195,394
Interest Rate
3.87%
Mortgage Type
FHA
Purchase Details
Closed on
Aug 8, 2014
Sold by
Dr Horton Crown Llc
Bought by
Bolton Marcus D
Home Financials for this Owner
Home Financials are based on the most recent Mortgage that was taken out on this home.
Original Mortgage
$207,403
Interest Rate
4.25%
Mortgage Type
FHA
Purchase Details
Closed on
May 27, 2014
Sold by
Jeffeson Homes Inc
Bought by
Dr Horton Crown Llc
Create a Home Valuation Report for This Property
The Home Valuation Report is an in-depth analysis detailing your home's value as well as a comparison with similar homes in the area
Home Values in the Area
Average Home Value in this Area
Purchase History
| Date | Buyer | Sale Price | Title Company |
|---|---|---|---|
| Adams Cherrie | -- | -- | |
| Adams Cherrie | $198,999 | -- | |
| Bolton Marcus D | $212,425 | -- | |
| Dr Horton Crown Llc | $60,000 | -- |
Source: Public Records
Mortgage History
| Date | Status | Borrower | Loan Amount |
|---|---|---|---|
| Previous Owner | Adams Cherrie | $195,394 | |
| Previous Owner | Bolton Marcus D | $207,403 |
Source: Public Records
Tax History Compared to Growth
Tax History
| Year | Tax Paid | Tax Assessment Tax Assessment Total Assessment is a certain percentage of the fair market value that is determined by local assessors to be the total taxable value of land and additions on the property. | Land | Improvement |
|---|---|---|---|---|
| 2025 | $5,076 | $141,560 | $10,400 | $131,160 |
| 2024 | $5,657 | $154,040 | $10,400 | $143,640 |
| 2023 | $5,079 | $140,680 | $10,400 | $130,280 |
| 2022 | $3,517 | $98,640 | $10,400 | $88,240 |
| 2021 | $3,188 | $89,760 | $10,400 | $79,360 |
| 2020 | $3,022 | $84,604 | $10,400 | $74,204 |
| 2019 | $3,078 | $84,880 | $9,600 | $75,280 |
| 2018 | $3,111 | $85,701 | $9,600 | $76,101 |
| 2017 | $2,935 | $81,183 | $9,600 | $71,583 |
| 2016 | $2,832 | $79,600 | $9,600 | $70,000 |
| 2015 | $3,248 | $0 | $0 | $0 |
| 2014 | -- | $631 | $631 | $0 |
Source: Public Records
Map
Nearby Homes
- 9997 Point View Dr
- 1172 Faulkner Way
- 10167 Cormac St
- 1091 Commons Ct Unit 2
- 10200 Commons Crossing Unit 1
- 1036 Walnut Creek Ln
- 1506 Mundys Mill Rd
- 1253 Todiway Ct
- 1157 Mundys Mill Rd
- 10197 Hamilton Glen
- 1131 Orr Rd
- 1296 Todiway Ct
- 10283 Richfield Ct
- 6648 Coker Way
- 10085 Brass Ring Rd
- 10065 Brass Ring Rd
- 6637 Chason Woods Ct
- 6632 Chason Woods Ct
- 9744 Carolina Dr
- 9870 Curries Crossing Unit I
- 9985 Chappell Ln
- 9979 Chappell Ln
- 9982 Cormac St Unit LOT 95
- 9982 Cormac St
- 10010 Chappell Ln
- 10016 Chappell Ln Unit LOT 62
- 9976 Cormac St
- 9973 Chappell Ln Unit LOT 98
- 9973 Chappell Ln
- 9996 Cormac St
- 9986 Chappell Ln Unit LOT 57
- 9986 Chappell Ln
- 9970 Cormac St
- 9980 Chappell Ln Unit LOT 56
- 9980 Chappell Ln
- 9992 Chappell Ln
- 9974 Chappell Ln
- 10004 Chappell Ln
- 9967 Chappell Ln
- 10002 Cormac St Unit LOT 63