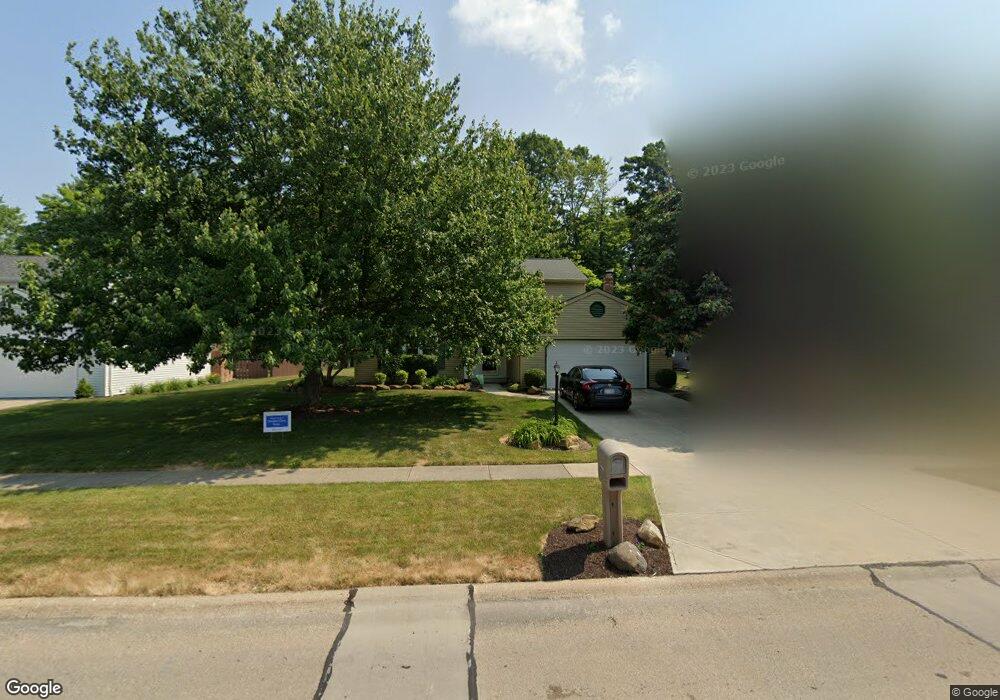
9985 Huntington Park Dr Strongsville, OH 44136
Estimated Value: $356,934 - $398,000
4
Beds
2
Baths
2,168
Sq Ft
$173/Sq Ft
Est. Value
About This Home
This home is located at 9985 Huntington Park Dr, Strongsville, OH 44136 and is currently estimated at $373,984, approximately $172 per square foot. 9985 Huntington Park Dr is a home located in Cuyahoga County with nearby schools including Strongsville High School, Sts Joseph & John Interparochial School, and The Academy of St. Bartholomew.
Ownership History
Date
Name
Owned For
Owner Type
Purchase Details
Closed on
May 31, 2002
Sold by
Ridge Dale and Ridge Judy
Bought by
Kramer Edward Scott and Kramer Maribeth
Current Estimated Value
Home Financials for this Owner
Home Financials are based on the most recent Mortgage that was taken out on this home.
Original Mortgage
$75,000
Outstanding Balance
$32,137
Interest Rate
7%
Estimated Equity
$341,847
Purchase Details
Closed on
May 14, 1993
Sold by
Greiner William R and Greiner Kathleen
Bought by
Ridge Dale
Purchase Details
Closed on
Dec 7, 1984
Bought by
Greiner William R and Greiner Kathleen
Purchase Details
Closed on
Sep 5, 1984
Bought by
Partridge Housing Corp Inc
Purchase Details
Closed on
Jan 1, 1984
Bought by
Whitney Land Dev Inc
Create a Home Valuation Report for This Property
The Home Valuation Report is an in-depth analysis detailing your home's value as well as a comparison with similar homes in the area
Home Values in the Area
Average Home Value in this Area
Purchase History
| Date | Buyer | Sale Price | Title Company |
|---|---|---|---|
| Kramer Edward Scott | $192,000 | Midland Title Security Inc | |
| Ridge Dale | $147,800 | -- | |
| Greiner William R | $91,200 | -- | |
| Partridge Housing Corp Inc | $16,300 | -- | |
| Whitney Land Dev Inc | -- | -- |
Source: Public Records
Mortgage History
| Date | Status | Borrower | Loan Amount |
|---|---|---|---|
| Open | Kramer Edward Scott | $75,000 |
Source: Public Records
Tax History Compared to Growth
Tax History
| Year | Tax Paid | Tax Assessment Tax Assessment Total Assessment is a certain percentage of the fair market value that is determined by local assessors to be the total taxable value of land and additions on the property. | Land | Improvement |
|---|---|---|---|---|
| 2024 | $5,019 | $106,890 | $24,325 | $82,565 |
| 2023 | $5,227 | $83,480 | $21,390 | $62,090 |
| 2022 | $5,189 | $83,480 | $21,390 | $62,090 |
| 2021 | $5,148 | $83,480 | $21,390 | $62,090 |
| 2020 | $5,017 | $71,960 | $18,450 | $53,520 |
| 2019 | $4,870 | $205,600 | $52,700 | $152,900 |
| 2018 | $4,367 | $71,960 | $18,450 | $53,520 |
| 2017 | $4,394 | $66,230 | $14,040 | $52,190 |
| 2016 | $4,358 | $66,230 | $14,040 | $52,190 |
| 2015 | $4,291 | $66,230 | $14,040 | $52,190 |
| 2014 | $4,291 | $64,300 | $13,620 | $50,680 |
Source: Public Records
Map
Nearby Homes
- 9945 Twelve Oaks Cir
- 10369 Council Bluff
- 9129 Tahoe Cir
- 9890 Webster Rd
- 10010 Chevy Chase
- 15485 Albion Rd
- 16519 Albion Rd
- 0 Webster Rd
- 9531 Nicole Cir
- 14069 Basswood Cir
- 18203 Broxton Dr
- 18433 Whitney Rd
- Buchanan Plan at The Enclave at Pine Lakes Crossing
- Belleville Plan at The Enclave at Pine Lakes Crossing
- 11650 River Moss Rd
- 12101 The Bluffs
- 14584 Baywood Ln
- 14557 Baywood Ln
- 14644 Baywood Ln
- 14298 Calderdale Ln
- 10007 Huntington Park Dr
- 9937 Huntington Park Dr
- 10029 Huntington Park Dr
- 9974 Huntington Park Dr
- 9861 Huntington Park Dr
- 10024 Huntington Park Dr
- 9926 Huntington Park Dr
- 10051 Huntington Park Dr
- 10046 Huntington Park Dr
- 9839 Huntington Park Dr
- 9878 Huntington Park Dr
- 9905 Dogwood Ct
- 15922 Inglewood Ct
- 9816 Twelve Oaks Cir
- 9811 N Bexley Dr
- 10090 Huntington Park Dr
- 9844 Twelve Oaks Cir
- 9830 Huntington Park Dr
- 9775 N Bexley Dr
- 9947 Dogwood Ct