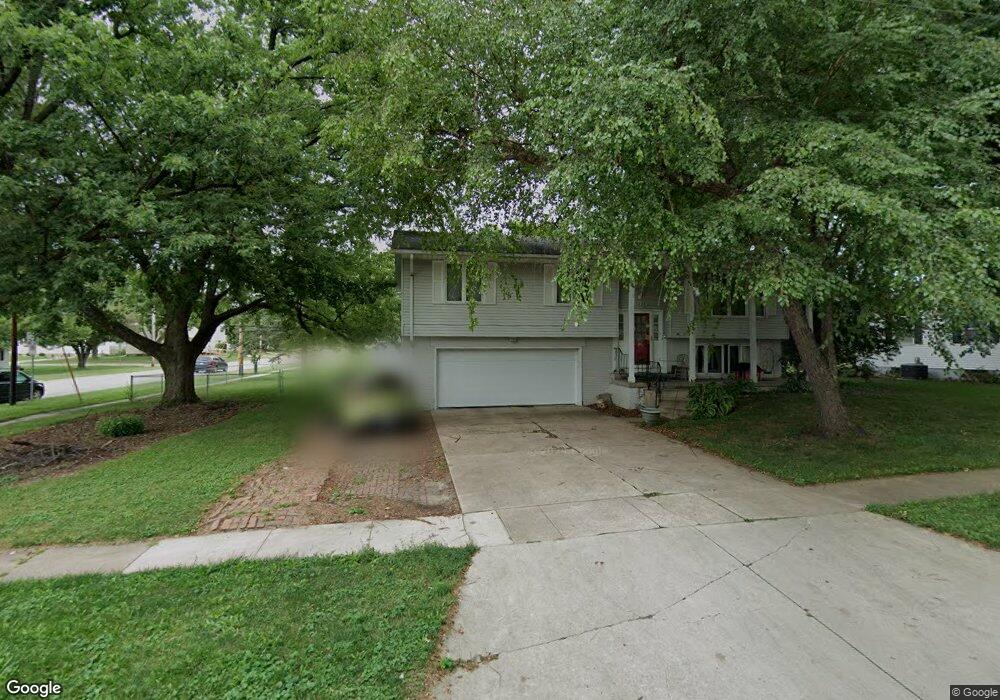
999 26th St Marion, IA 52302
Estimated Value: $226,000 - $247,000
3
Beds
2
Baths
1,296
Sq Ft
$183/Sq Ft
Est. Value
About This Home
This home is located at 999 26th St, Marion, IA 52302 and is currently estimated at $236,746, approximately $182 per square foot. 999 26th St is a home located in Linn County with nearby schools including Longfellow Elementary, Francis Marion Intermediate School, and Vernon Middle School.
Ownership History
Date
Name
Owned For
Owner Type
Purchase Details
Closed on
Feb 22, 2006
Sold by
Whitney Wayland D and Whitney Jennifer A
Bought by
Reid Gary L and Reid Debra D
Current Estimated Value
Home Financials for this Owner
Home Financials are based on the most recent Mortgage that was taken out on this home.
Original Mortgage
$136,917
Outstanding Balance
$77,079
Interest Rate
6.2%
Mortgage Type
FHA
Estimated Equity
$159,667
Purchase Details
Closed on
May 29, 1998
Sold by
Sanchez Oscar D and Sanchez Kathleen M
Bought by
Whitney Wayland D and Whitney Jennifer A
Home Financials for this Owner
Home Financials are based on the most recent Mortgage that was taken out on this home.
Original Mortgage
$100,830
Interest Rate
7.27%
Create a Home Valuation Report for This Property
The Home Valuation Report is an in-depth analysis detailing your home's value as well as a comparison with similar homes in the area
Home Values in the Area
Average Home Value in this Area
Purchase History
We collect this data history from publicly available records. To have your information removed, we recommend requesting removal directly through your county’s website.
| Date | Buyer | Sale Price | Title Company |
|---|---|---|---|
| Reid Gary L | $137,500 | None Available | |
| Whitney Wayland D | $103,500 | -- |
Source: Public Records
Mortgage History
We collect this data history from publicly available records. To have your information removed, we recommend requesting removal directly through your county’s website.
| Date | Status | Borrower | Loan Amount |
|---|---|---|---|
| Open | Reid Gary L | $136,917 | |
| Previous Owner | Whitney Wayland D | $100,830 |
Source: Public Records
Tax History
| Year | Tax Paid | Tax Assessment Tax Assessment Total Assessment is a certain percentage of the fair market value that is determined by local assessors to be the total taxable value of land and additions on the property. | Land | Improvement |
|---|---|---|---|---|
| 2025 | $3,572 | $221,400 | $26,900 | $194,500 |
| 2024 | $3,664 | $207,800 | $26,900 | $180,900 |
| 2023 | $3,664 | $207,800 | $26,900 | $180,900 |
| 2022 | $3,538 | $173,500 | $26,900 | $146,600 |
| 2021 | $3,264 | $173,500 | $26,900 | $146,600 |
| 2020 | $3,264 | $153,000 | $26,900 | $126,100 |
| 2019 | $3,034 | $143,200 | $28,600 | $114,600 |
| 2018 | $2,942 | $143,200 | $28,600 | $114,600 |
| 2017 | $3,000 | $134,800 | $28,600 | $106,200 |
| 2016 | $3,000 | $134,800 | $28,600 | $106,200 |
| 2015 | $2,987 | $134,800 | $28,600 | $106,200 |
| 2014 | $2,794 | $134,800 | $28,600 | $106,200 |
| 2013 | $2,682 | $134,800 | $28,600 | $106,200 |
Source: Public Records
Map
Nearby Homes
- 1045 25th St
- 1103 26th St
- 1100 29th St
- 2765 14th Ave
- 2265 11th Ave
- 1630 25th St
- 2015 8th Ave
- 1990 8th Ave
- 1799 Park Ave
- 3220 Sunburst Ave
- 3225 Willowridge Rd Unit D
- 3250 Sunburst Ave Unit 3250
- 3170 Willowridge Rd Unit C
- 2455 Mcgowan Blvd
- 3015 4th Ave
- 850 35th St
- 3260 Willowridge Rd Unit D
- 3445 Willowridge Rd Unit C
- 1621 6th Ave
- 1805 Brockman Ave
Your Personal Tour Guide
Ask me questions while you tour the home.