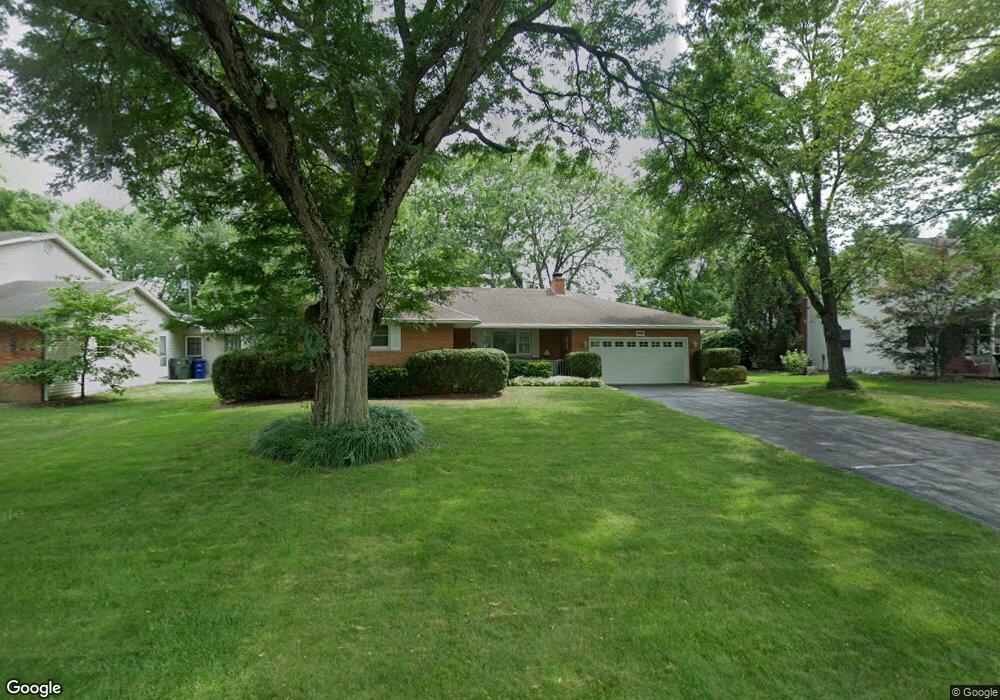
999 Greenridge Rd Columbus, OH 43235
Indian Hills NeighborhoodEstimated Value: $438,000 - $537,000
3
Beds
3
Baths
1,665
Sq Ft
$281/Sq Ft
Est. Value
About This Home
This home is located at 999 Greenridge Rd, Columbus, OH 43235 and is currently estimated at $467,172, approximately $280 per square foot. 999 Greenridge Rd is a home located in Franklin County with nearby schools including Gables Elementary School, Ridgeview Middle School, and Centennial High School.
Ownership History
Date
Name
Owned For
Owner Type
Purchase Details
Closed on
Dec 6, 2013
Sold by
Dilley Robert F and Dilley Cheryl R
Bought by
Dilley Robert F and Dilley Cheryl R
Current Estimated Value
Purchase Details
Closed on
Oct 14, 2011
Sold by
Mowery David and Estate Of Otto R Mowery
Bought by
Dilley Robert F and Dilley Cheryl R
Home Financials for this Owner
Home Financials are based on the most recent Mortgage that was taken out on this home.
Original Mortgage
$155,600
Outstanding Balance
$104,664
Interest Rate
4.12%
Mortgage Type
Purchase Money Mortgage
Estimated Equity
$362,508
Purchase Details
Closed on
Oct 21, 2005
Sold by
Randels James B and Randels Helen K
Bought by
Mowery Otto R and Mowery Marjorie K
Purchase Details
Closed on
Aug 7, 1967
Bought by
Randels James B
Create a Home Valuation Report for This Property
The Home Valuation Report is an in-depth analysis detailing your home's value as well as a comparison with similar homes in the area
Home Values in the Area
Average Home Value in this Area
Purchase History
| Date | Buyer | Sale Price | Title Company |
|---|---|---|---|
| Dilley Robert F | -- | None Available | |
| Dilley Robert F | $194,500 | Fati | |
| Mowery Otto R | $210,000 | Peak Title | |
| Randels James B | -- | -- |
Source: Public Records
Mortgage History
| Date | Status | Borrower | Loan Amount |
|---|---|---|---|
| Open | Dilley Robert F | $155,600 |
Source: Public Records
Tax History
| Year | Tax Paid | Tax Assessment Tax Assessment Total Assessment is a certain percentage of the fair market value that is determined by local assessors to be the total taxable value of land and additions on the property. | Land | Improvement |
|---|---|---|---|---|
| 2025 | $5,240 | $126,560 | $53,480 | $73,080 |
| 2024 | $5,240 | $126,560 | $53,480 | $73,080 |
| 2023 | $5,201 | $126,560 | $53,480 | $73,080 |
| 2022 | $5,139 | $107,840 | $30,420 | $77,420 |
| 2021 | $5,148 | $107,840 | $30,420 | $77,420 |
| 2020 | $5,155 | $107,840 | $30,420 | $77,420 |
| 2019 | $4,667 | $85,690 | $24,330 | $61,360 |
| 2018 | $4,482 | $85,690 | $24,330 | $61,360 |
| 2017 | $4,665 | $85,690 | $24,330 | $61,360 |
| 2016 | $4,744 | $80,360 | $19,810 | $60,550 |
| 2015 | $4,306 | $80,360 | $19,810 | $60,550 |
| 2014 | $4,317 | $80,360 | $19,810 | $60,550 |
| 2013 | $1,964 | $74,795 | $18,865 | $55,930 |
Source: Public Records
Map
Nearby Homes
- 5644 Linworth Rd
- 6074 Tulip Hill Rd
- 5936 Aqua Bay Dr
- 5938 Aqua Bay Dr
- 788 Katherines Ridge Ln
- 962 Augusta Glen Dr
- 876 Middlebury Dr N
- 1252 Brookridge Dr
- 913 White Willow Ln Unit 913
- 1881 W Dublin Granville Rd
- 511 W Kanawha Ave
- 5520 Ellinger St
- 1138 Slade Ave
- 1566 Lorraine Ave
- 252 W Kanawha Ave
- 162 Broad Meadows Blvd
- 1221 Bethel Rd
- 5118 Dalmeny Ct Unit 5118
- 5200 Fenway Ct Unit B
- 131 Broad Meadows Blvd
- 1011 Greenridge Rd
- 989 Greenridge Rd
- 5820 Stoney Creek Ct
- 1025 Greenridge Rd
- 5812 Stoney Creek Ct
- 979 Greenridge Rd
- 5870 Sedgwick Rd
- 1000 Greenridge Rd
- 990 Greenridge Rd
- 5815 Stoney Creek Ct
- 970 Stoney Creek Rd
- 1039 Greenridge Rd
- 969 Greenridge Rd
- 980 Greenridge Rd
- 990 Stoney Creek Rd
- 5880 Sedgwick Rd
- 960 Stoney Creek Rd
- 5811 Stoney Creek Ct
- 1040 Greenridge Rd
- 966 Greenridge Rd
Your Personal Tour Guide
Ask me questions while you tour the home.