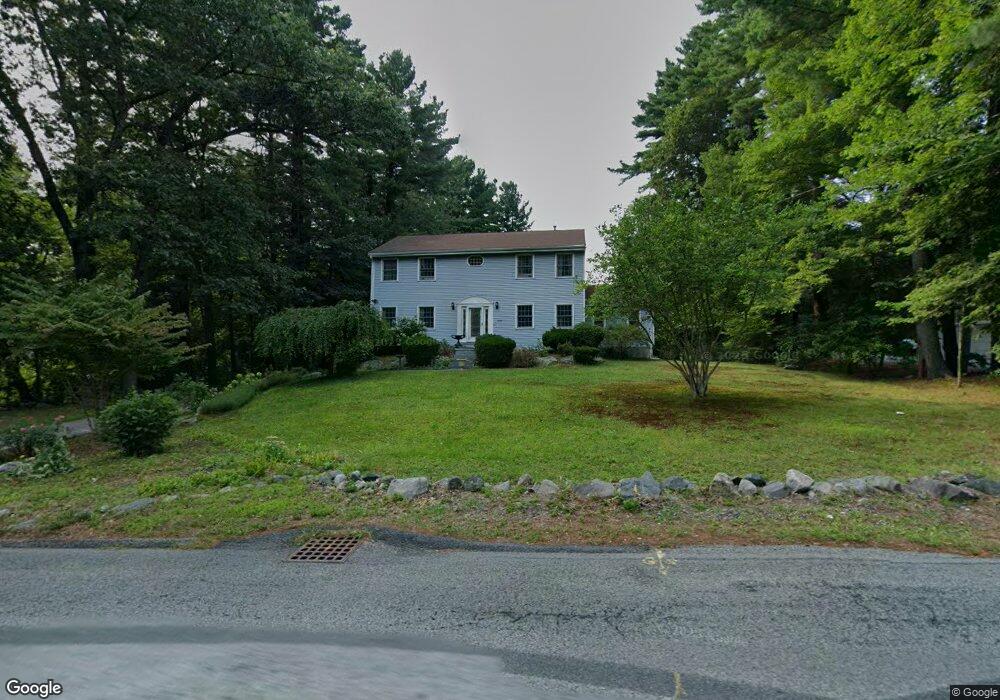
999 West St Mansfield, MA 02048
Estimated Value: $817,335 - $907,000
4
Beds
3
Baths
2,744
Sq Ft
$315/Sq Ft
Est. Value
About This Home
This home is located at 999 West St, Mansfield, MA 02048 and is currently estimated at $864,834, approximately $315 per square foot. 999 West St is a home located in Bristol County with nearby schools including Everett W. Robinson Elementary School, Jordan/Jackson Elementary School, and Harold L. Qualters Middle School.
Ownership History
Date
Name
Owned For
Owner Type
Purchase Details
Closed on
Jul 26, 1995
Sold by
Mansfield Assembly Of
Bought by
Deandrade Agnelo and Sanches Amelia P
Current Estimated Value
Home Financials for this Owner
Home Financials are based on the most recent Mortgage that was taken out on this home.
Original Mortgage
$153,000
Interest Rate
7.56%
Mortgage Type
Purchase Money Mortgage
Purchase Details
Closed on
Jul 27, 1989
Sold by
Assem So Ne Distr
Bought by
Mansfld Assemb God Inc
Create a Home Valuation Report for This Property
The Home Valuation Report is an in-depth analysis detailing your home's value as well as a comparison with similar homes in the area
Home Values in the Area
Average Home Value in this Area
Purchase History
| Date | Buyer | Sale Price | Title Company |
|---|---|---|---|
| Deandrade Agnelo | $170,000 | -- | |
| Mansfld Assemb God Inc | $60,000 | -- |
Source: Public Records
Mortgage History
| Date | Status | Borrower | Loan Amount |
|---|---|---|---|
| Open | Mansfld Assemb God Inc | $85,600 | |
| Open | Mansfld Assemb God Inc | $240,000 | |
| Closed | Mansfld Assemb God Inc | $208,300 | |
| Closed | Mansfld Assemb God Inc | $153,000 |
Source: Public Records
Tax History Compared to Growth
Tax History
| Year | Tax Paid | Tax Assessment Tax Assessment Total Assessment is a certain percentage of the fair market value that is determined by local assessors to be the total taxable value of land and additions on the property. | Land | Improvement |
|---|---|---|---|---|
| 2025 | $8,645 | $656,400 | $248,500 | $407,900 |
| 2024 | $8,388 | $621,300 | $248,500 | $372,800 |
| 2023 | $8,083 | $573,700 | $248,500 | $325,200 |
| 2022 | $7,769 | $512,100 | $230,100 | $282,000 |
| 2021 | $4,863 | $500,900 | $201,300 | $299,600 |
| 2020 | $7,423 | $483,300 | $191,700 | $291,600 |
| 2019 | $3,762 | $454,000 | $159,700 | $294,300 |
| 2018 | $4,352 | $441,400 | $152,400 | $289,000 |
| 2017 | $3,389 | $429,100 | $148,100 | $281,000 |
| 2016 | $6,313 | $409,700 | $140,900 | $268,800 |
| 2015 | $6,136 | $395,900 | $140,900 | $255,000 |
Source: Public Records
Map
Nearby Homes