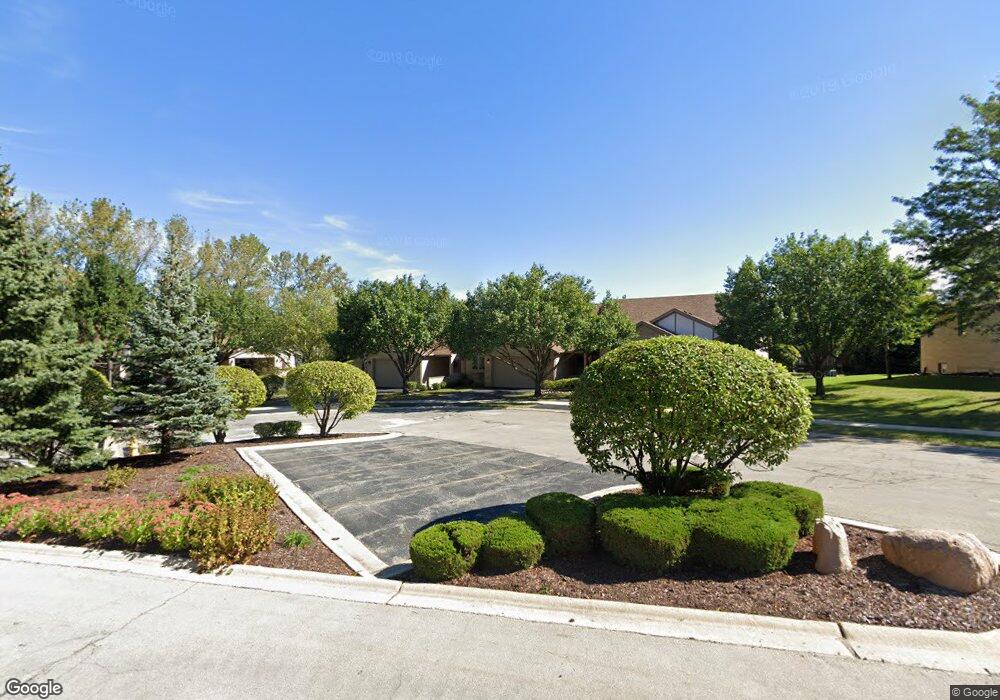
9S231 Clarenbrook Ct Willowbrook, IL 60527
Estimated Value: $368,000 - $560,000
2
Beds
2
Baths
1,770
Sq Ft
$262/Sq Ft
Est. Value
About This Home
This home is located at 9S231 Clarenbrook Ct, Willowbrook, IL 60527 and is currently estimated at $462,959, approximately $261 per square foot. 9S231 Clarenbrook Ct is a home located in DuPage County with nearby schools including Concord Elementary School, Cass Jr High School, and Hinsdale South High School.
Ownership History
Date
Name
Owned For
Owner Type
Purchase Details
Closed on
Oct 19, 2012
Sold by
National Residential Nominee Services In
Bought by
Jeffers Dawn and Throne Rose Marie
Current Estimated Value
Purchase Details
Closed on
Oct 15, 2012
Sold by
Hoisington Steven H
Bought by
National Residential Nominee Services In
Purchase Details
Closed on
Jun 13, 2007
Sold by
Burdett Helen
Bought by
Hoisington Steven H
Home Financials for this Owner
Home Financials are based on the most recent Mortgage that was taken out on this home.
Original Mortgage
$130,000
Interest Rate
6.2%
Mortgage Type
Purchase Money Mortgage
Purchase Details
Closed on
Aug 28, 2002
Sold by
Burdett Helen
Bought by
Burdett Helen and Helen Burdett Declaration Of Trust #001
Purchase Details
Closed on
Jun 13, 2002
Sold by
Makowski Frances
Bought by
Burdett Helen
Purchase Details
Closed on
Aug 14, 2000
Sold by
Amalgamated Bank Of Chicago
Bought by
Makowski Frances
Create a Home Valuation Report for This Property
The Home Valuation Report is an in-depth analysis detailing your home's value as well as a comparison with similar homes in the area
Home Values in the Area
Average Home Value in this Area
Purchase History
| Date | Buyer | Sale Price | Title Company |
|---|---|---|---|
| Jeffers Dawn | $310,000 | Fidelity National Title | |
| National Residential Nominee Services In | $310,000 | None Available | |
| Hoisington Steven H | $315,000 | Chicago Title Insurance Co | |
| Burdett Helen | -- | -- | |
| Burdett Helen | $267,000 | Ticor Title | |
| Makowski Frances | $232,000 | -- |
Source: Public Records
Mortgage History
| Date | Status | Borrower | Loan Amount |
|---|---|---|---|
| Previous Owner | Hoisington Steven H | $130,000 |
Source: Public Records
Tax History
| Year | Tax Paid | Tax Assessment Tax Assessment Total Assessment is a certain percentage of the fair market value that is determined by local assessors to be the total taxable value of land and additions on the property. | Land | Improvement |
|---|---|---|---|---|
| 2024 | $7,907 | $140,326 | $34,407 | $105,919 |
| 2023 | $7,603 | $129,000 | $31,630 | $97,370 |
| 2022 | $7,541 | $127,600 | $31,290 | $96,310 |
| 2021 | $6,944 | $126,140 | $30,930 | $95,210 |
| 2020 | $6,841 | $123,640 | $30,320 | $93,320 |
| 2019 | $6,599 | $118,630 | $29,090 | $89,540 |
| 2018 | $6,242 | $115,740 | $28,380 | $87,360 |
| 2017 | $6,169 | $111,370 | $27,310 | $84,060 |
| 2016 | $5,994 | $106,280 | $26,060 | $80,220 |
| 2015 | $5,876 | $99,990 | $24,520 | $75,470 |
| 2014 | $5,772 | $97,220 | $23,840 | $73,380 |
| 2013 | $5,543 | $96,770 | $23,730 | $73,040 |
Source: Public Records
Map
Nearby Homes
- 7925 William Dr
- 225 Sunrise Ave
- 7730 Virginia Ct
- 8412 Meadowbrook Dr
- 8313 Highpoint Cir Unit F
- 7604 Eleanor Place
- 7725 Sawyer Rd
- 7700 Apple Tree Ln
- 709 79th St Unit 408
- 801 79th St Unit 310
- 7816 Dorchester Ln
- 8625 Meadowbrook Dr
- 17W435 Concord Place
- 7800 Dorchester Ln
- Lot 1, 2, 3, 4 & 5 Nantucket Dr
- 15W670 83rd St
- 16W130 89th St
- 8167 Ripple Ridge Unit 8167
- 1052 Ripple Ridge
- 10S381 S Madison St
- 9S235 Clarenbrook Ct
- 9S227 Clarenbrook Ct
- 9S249 Clarenbrook Ct
- 9S215 Clarenbrook Ct
- 9S255 Clarenbrook Ct
- 9S217 Clarenbrook Ct Unit 9
- 9-S125 Lake Dr Unit 21-209
- 9S259 Clarenbrook Ct
- 9S213 Clarenbrook Ct
- 9s Clarenbrook Ct Unit B
- 9S238 Clarenbrook Ct
- 9S263 Clarenbrook Ct
- 9S234 Clarenbrook Ct
- 9S234 Clarenbrook Ct Unit 12
- 9S230 Clarenbrook Ct
- 9S242 Clarenbrook Ct
- 9S246 Clarenbrook Ct
- 9S246 Clarenbrook Ct Unit 246
- 9S258 Clarenbrook Ct
- 9S264 Clarenbrook Ct
Your Personal Tour Guide
Ask me questions while you tour the home.