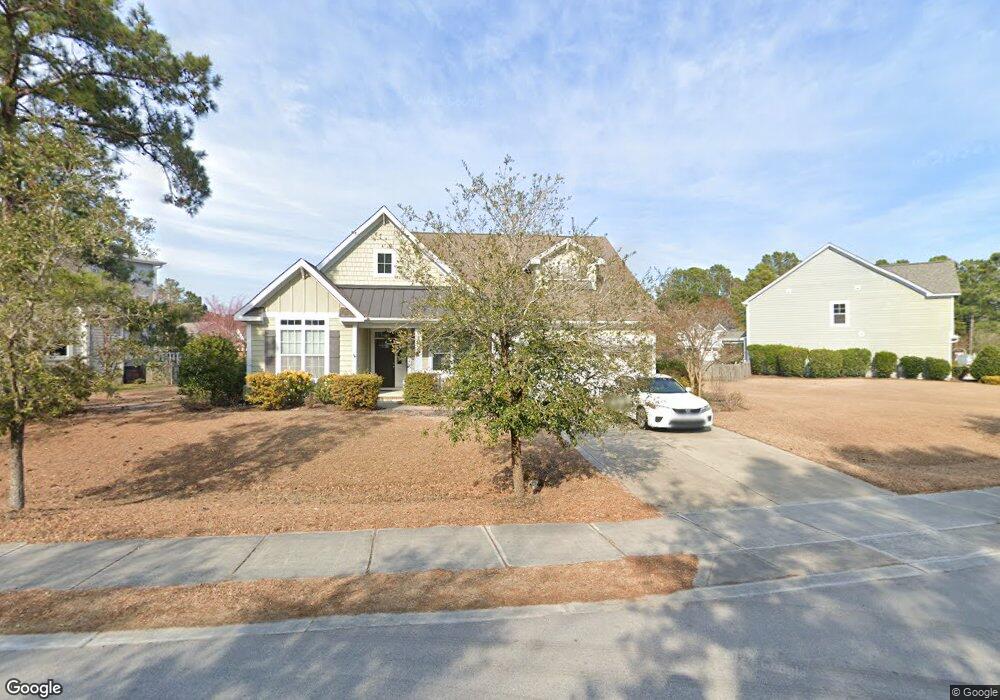
138 Saltwater Landing Dr Unit 37726335 Hampstead, NC 28443
Estimated Value: $468,000 - $576,000
4
Beds
3
Baths
2,376
Sq Ft
$224/Sq Ft
Est. Value
About This Home
This home is located at 138 Saltwater Landing Dr Unit 37726335, Hampstead, NC 28443 and is currently estimated at $531,805, approximately $223 per square foot. 138 Saltwater Landing Dr Unit 37726335 is a home located in Pender County with nearby schools including North Topsail Elementary School, Topsail Middle School, and Topsail High School.
Ownership History
Date
Name
Owned For
Owner Type
Purchase Details
Closed on
Nov 4, 2016
Sold by
Garrison Christopher S and Calain Jodie A
Bought by
Lotten Charles S and Lotten Dorothy J
Current Estimated Value
Home Financials for this Owner
Home Financials are based on the most recent Mortgage that was taken out on this home.
Original Mortgage
$200,000
Outstanding Balance
$160,868
Interest Rate
3.48%
Mortgage Type
New Conventional
Estimated Equity
$370,937
Purchase Details
Closed on
May 30, 2013
Sold by
Bill Clark Homes Of Wilmington Llc
Bought by
Garrison Christopher S and Calain Jodie A
Home Financials for this Owner
Home Financials are based on the most recent Mortgage that was taken out on this home.
Original Mortgage
$257,400
Interest Rate
3.43%
Mortgage Type
VA
Purchase Details
Closed on
Jun 4, 2012
Sold by
Saltwalter Landing Llc
Bought by
Bill Clark Homes Of Wilmington Llc
Create a Home Valuation Report for This Property
The Home Valuation Report is an in-depth analysis detailing your home's value as well as a comparison with similar homes in the area
Home Values in the Area
Average Home Value in this Area
Purchase History
| Date | Buyer | Sale Price | Title Company |
|---|---|---|---|
| Lotten Charles S | $270,000 | None Available | |
| Garrison Christopher S | $252,000 | None Available | |
| Bill Clark Homes Of Wilmington Llc | $70,000 | None Available |
Source: Public Records
Mortgage History
| Date | Status | Borrower | Loan Amount |
|---|---|---|---|
| Open | Lotten Charles S | $200,000 | |
| Previous Owner | Garrison Christopher S | $257,400 |
Source: Public Records
Tax History Compared to Growth
Tax History
| Year | Tax Paid | Tax Assessment Tax Assessment Total Assessment is a certain percentage of the fair market value that is determined by local assessors to be the total taxable value of land and additions on the property. | Land | Improvement |
|---|---|---|---|---|
| 2024 | $2,522 | $303,847 | $56,752 | $247,095 |
| 2023 | $2,522 | $303,847 | $56,752 | $247,095 |
| 2022 | $2,241 | $303,847 | $56,752 | $247,095 |
| 2021 | $2,241 | $303,847 | $56,752 | $247,095 |
| 2020 | $2,241 | $303,847 | $56,752 | $247,095 |
| 2019 | $2,241 | $303,847 | $56,752 | $247,095 |
| 2018 | $1,886 | $242,562 | $54,000 | $188,562 |
| 2017 | $1,886 | $242,562 | $54,000 | $188,562 |
| 2016 | $1,862 | $242,562 | $54,000 | $188,562 |
| 2015 | $1,862 | $242,562 | $54,000 | $188,562 |
| 2014 | $1,418 | $242,562 | $54,000 | $188,562 |
| 2013 | -- | $242,562 | $54,000 | $188,562 |
| 2012 | -- | $45,000 | $45,000 | $0 |
Source: Public Records
Map
Nearby Homes
- Oleander Plan at Magnolia Reserve
- Masonboro Plan at Magnolia Reserve
- Otter Plan at Magnolia Reserve
- Madison Plan at Magnolia Reserve
- 105 Lennox Ln
- 100 Lennox Ln
- 116 E Barred Owl Dr
- 101 N Alena Ct
- 104 N Alena Ct
- 504 Creek Dr
- 618 Creek Dr
- Tr 1 Nc Highway 210 E
- Tr 8 Nc Hwy 210
- Tr 7 Nc Hwy 210
- 141.83 Acres Watts Landing Rd
- Tr 6 Nc Hwy 210
- 131 Marcil Ln
- Tr 3 E Florence
- 166 Watts Landing Rd
- 4 Watts Landing Rd
- 138 Saltwater Landing Dr
- 136 Saltwater Landing Dr
- 140 Saltwater Landing Dr
- 105 N Brig Dr
- 141 Saltwater Landing Dr
- 134 Saltwater Landing Dr
- 143 Saltwater Landing Dr
- 139 Saltwater Landing Dr
- 145 Saltwater Landing Dr
- 137 N Brig Dr
- L35 N Brig Dr
- 101 N Brig Dr
- 204 N Brig Dr
- lot22 N Brig Dr
- 0 N Brig Dr
- 112 N Brig Dr
- L28 N Brig Dr
- 109 N Brig Dr
- 137 Saltwater Landing Dr