170 Westminster St Providence, RI 02903
Downtown Providence NeighborhoodEstimated Value: $11,863,812
--
Bed
--
Bath
76,822
Sq Ft
$154/Sq Ft
Est. Value
About This Home
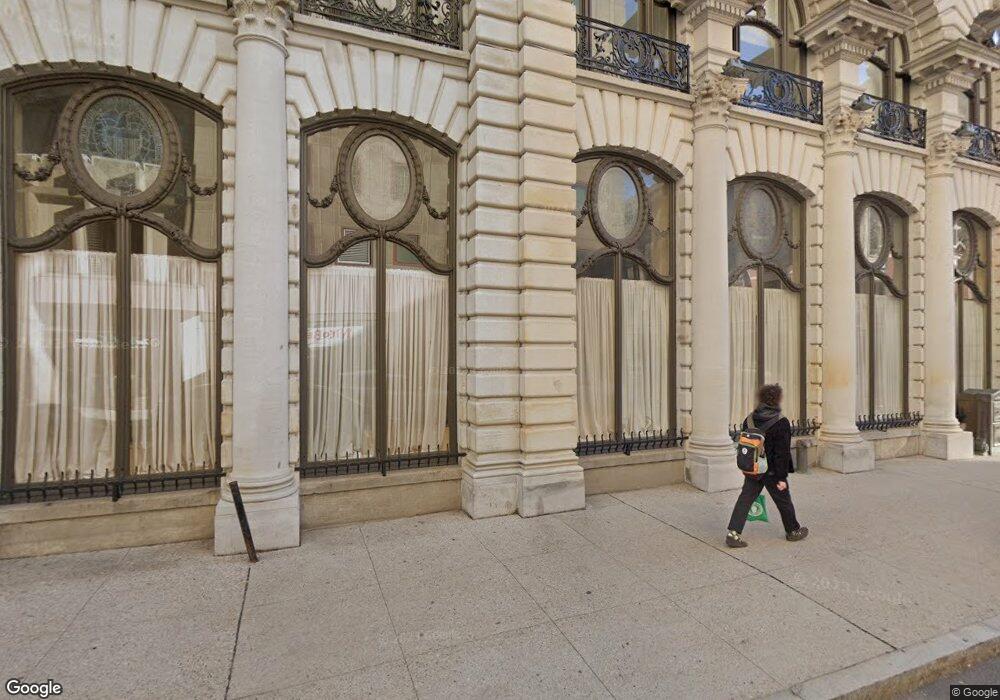
This home is located at 170 Westminster St, Providence, RI 02903 and is currently estimated at $11,863,812, approximately $154 per square foot. 170 Westminster St is a home located in Providence County with nearby schools including Asa Messer Elementary School, Charles N. Fortes Elementary School, and Robert L. Bailey IV Elementary.
Ownership History
Date
Name
Owned For
Owner Type
Purchase Details
Closed on
Mar 5, 2015
Sold by
170 Westminster St Llc
Bought by
Providence Capital 3 L
Current Estimated Value
Home Financials for this Owner
Home Financials are based on the most recent Mortgage that was taken out on this home.
Original Mortgage
$8,000,000
Outstanding Balance
$6,100,142
Interest Rate
3.64%
Mortgage Type
Commercial
Estimated Equity
$5,763,670
Purchase Details
Closed on
Jul 3, 2007
Sold by
Granoff Realty Lp
Bought by
170 Westminster St Llc
Home Financials for this Owner
Home Financials are based on the most recent Mortgage that was taken out on this home.
Original Mortgage
$7,800,000
Interest Rate
6.24%
Mortgage Type
Commercial
Purchase Details
Closed on
Jul 13, 2000
Sold by
Westminster 90
Bought by
Granoff Realty Lp
Create a Home Valuation Report for This Property
The Home Valuation Report is an in-depth analysis detailing your home's value as well as a comparison with similar homes in the area
Home Values in the Area
Average Home Value in this Area
Purchase History
| Date | Buyer | Sale Price | Title Company |
|---|---|---|---|
| Providence Capital 3 L | -- | -- | |
| 170 Westminster St Llc | $6,550,000 | -- | |
| Granoff Realty Lp | $2,250,000 | -- |
Source: Public Records
Mortgage History
| Date | Status | Borrower | Loan Amount |
|---|---|---|---|
| Open | Providence Capital 3 L | $8,000,000 | |
| Previous Owner | Granoff Realty Lp | $3,000,000 | |
| Previous Owner | Granoff Realty Lp | $7,800,000 |
Source: Public Records
Tax History Compared to Growth
Tax History
| Year | Tax Paid | Tax Assessment Tax Assessment Total Assessment is a certain percentage of the fair market value that is determined by local assessors to be the total taxable value of land and additions on the property. | Land | Improvement |
|---|---|---|---|---|
| 2025 | $239,326 | $16,445,000 | $629,700 | $15,815,300 |
| 2024 | $239,326 | $11,751,600 | $629,700 | $11,121,900 |
| 2023 | $239,326 | $11,751,600 | $629,700 | $11,121,900 |
| 2022 | $0 | $11,751,600 | $629,700 | $11,121,900 |
| 2021 | $0 | $9,217,600 | $549,900 | $8,667,700 |
| 2020 | $0 | $6,502,400 | $549,900 | $5,952,500 |
| 2019 | $0 | $6,502,400 | $549,900 | $5,952,500 |
| 2018 | $202,573 | $5,519,700 | $549,900 | $4,969,800 |
| 2017 | $202,573 | $5,519,700 | $549,900 | $4,969,800 |
| 2016 | $202,573 | $5,519,700 | $549,900 | $4,969,800 |
| 2015 | $181,049 | $4,926,500 | $523,800 | $4,402,700 |
| 2014 | $181,049 | $4,926,500 | $523,800 | $4,402,700 |
| 2013 | $181,049 | $4,926,500 | $523,800 | $4,402,700 |
Source: Public Records
Map
Nearby Homes
- 65 Weybosset St Unit 211
- 65 Weybosset St Unit 314
- 65 Weybosset St Unit 202
- 65 Weybosset St Unit 223
- 93 Eddy St
- 225 Weybosset St Unit 12
- 225 Weybosset St Unit 2
- 385 Westminster St Unit 5C
- 1 W Exchange St Unit 2604
- 1 W Exchange St Unit 2802
- 200 Exchange St Unit 414
- 100 Exchange St Unit 1301
- 100 Exchange St Unit 501
- 100 Exchange St Unit 1107
- 100 Exchange St Unit 605
- 281 Benefit St Unit D
- 40 N Court St
- 34 Congdon St
- 7 W Cushing St
- 6 Olive St
- 170 Westminster St
- 76 Dorrance St
- 76 Dorrance St
- 145 Westminster St Unit 2
- 145 Westminster St Unit 3
- 10 Dorrance St
- 123 Confidential St
- 9999 Atwells Ave
- 201 Westminster St
- 204 Westminster St Unit 4B
- 204 Westminster St
- 69 Kennedy Plaza
- 55 Dorrance St
- 65 Weybosset St
- 65 Weybosset St Unit 319
- 65 Weybosset St Unit 116-117
- 65 Weybosset St Unit 118-119
- 65 Weybosset St
- 65 Weybosset St Unit 104
- 65 Weybosset St Unit 222