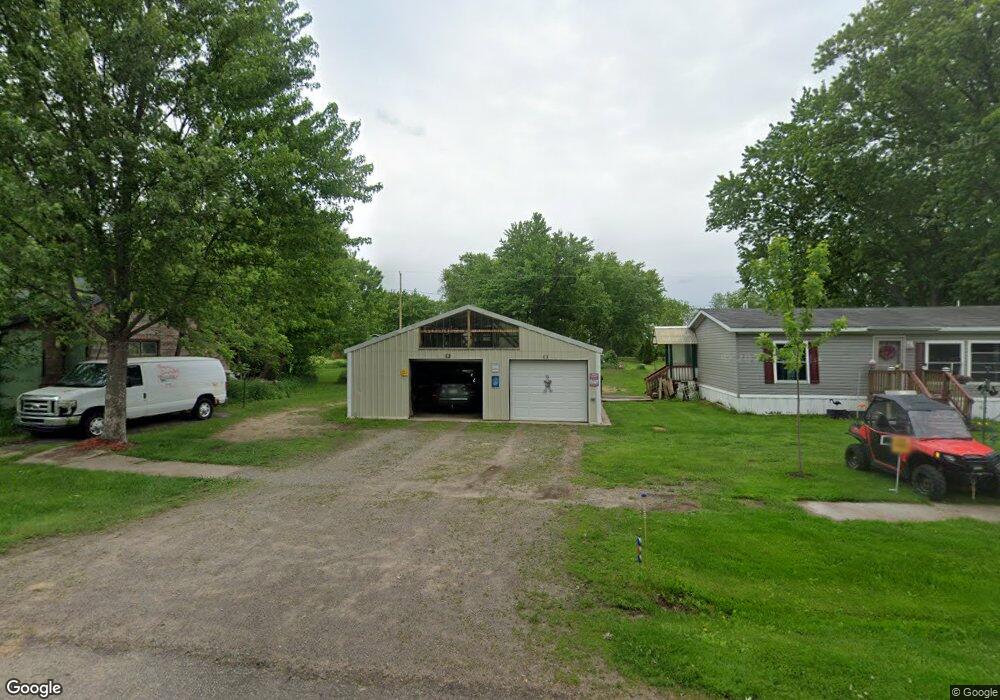
N3028 Clark St Humbird, WI 54746
Estimated Value: $119,000 - $171,000
3
Beds
2
Baths
1,188
Sq Ft
$116/Sq Ft
Est. Value
About This Home
This home is located at N3028 Clark St, Humbird, WI 54746 and is currently estimated at $138,128, approximately $116 per square foot. N3028 Clark St is a home located in Clark County with nearby schools including Lincoln Elementary School and Lincoln Junior/Senior High School.
Ownership History
Date
Name
Owned For
Owner Type
Purchase Details
Closed on
Mar 12, 2021
Sold by
Karstens John
Bought by
Reinwand Andrew J
Current Estimated Value
Home Financials for this Owner
Home Financials are based on the most recent Mortgage that was taken out on this home.
Original Mortgage
$84,550
Outstanding Balance
$75,793
Interest Rate
2.7%
Mortgage Type
New Conventional
Estimated Equity
$62,335
Purchase Details
Closed on
Aug 26, 2020
Sold by
Jansen Michael P and Jansen Susan K
Bought by
Karstens John
Purchase Details
Closed on
May 12, 2017
Sold by
Co & Op Credit Union
Bought by
Jansen Michael P and Jansen Susan K
Home Financials for this Owner
Home Financials are based on the most recent Mortgage that was taken out on this home.
Original Mortgage
$61,000
Interest Rate
3.97%
Mortgage Type
New Conventional
Purchase Details
Closed on
Jun 13, 2016
Sold by
Burkhalter Mavis A
Bought by
Co-Op Credit Union
Create a Home Valuation Report for This Property
The Home Valuation Report is an in-depth analysis detailing your home's value as well as a comparison with similar homes in the area
Home Values in the Area
Average Home Value in this Area
Purchase History
| Date | Buyer | Sale Price | Title Company |
|---|---|---|---|
| Reinwand Andrew J | $89,000 | Schuster Campman | |
| Reinwand Andrew J | $89,000 | None Listed On Document | |
| Karstens John | $55,000 | None Available | |
| Jansen Michael P | $34,000 | None Available | |
| Co-Op Credit Union | $40,000 | -- |
Source: Public Records
Mortgage History
| Date | Status | Borrower | Loan Amount |
|---|---|---|---|
| Open | Reinwand Andrew J | $84,550 | |
| Closed | Reinwand Andrew J | $84,550 | |
| Previous Owner | Jansen Michael P | $61,000 |
Source: Public Records
Tax History Compared to Growth
Tax History
| Year | Tax Paid | Tax Assessment Tax Assessment Total Assessment is a certain percentage of the fair market value that is determined by local assessors to be the total taxable value of land and additions on the property. | Land | Improvement |
|---|---|---|---|---|
| 2024 | $2,132 | $92,500 | $14,500 | $78,000 |
| 2023 | $1,903 | $86,000 | $14,500 | $71,500 |
| 2022 | $1,619 | $81,000 | $14,500 | $66,500 |
| 2021 | $1,902 | $81,000 | $14,500 | $66,500 |
| 2020 | $1,663 | $58,800 | $13,700 | $45,100 |
| 2019 | $1,559 | $58,800 | $13,700 | $45,100 |
| 2018 | $1,508 | $58,800 | $13,700 | $45,100 |
| 2017 | $367 | $56,100 | $13,700 | $42,400 |
| 2016 | $1,418 | $56,100 | $13,700 | $42,400 |
| 2015 | -- | $56,100 | $13,700 | $42,400 |
| 2014 | -- | $56,100 | $13,700 | $42,400 |
| 2013 | -- | $56,100 | $13,700 | $42,400 |
| 2011 | -- | $56,100 | $13,700 | $42,400 |
Source: Public Records
Map
Nearby Homes
- W11421 Alderman St
- 0 Elker Rd
- Cty Rd B
- 0 Elker Rd
- 0 Walkers Rd
- W11601 Sand Rd
- 57 acres E Gjerseth Rd
- 202 E Clark St
- 200 W Charles St
- 0 U S 12
- W11515 Wisconsin 95
- 218 E Main St
- +/- 13 Acres County B Monthei Rd
- 600 S Hayden St
- 218 E Clark St
- 340 E Main St
- TBD Cr 132 N
- TBD 3 & 4 Bootjack Rd
- W10362 Lower Lake Dr
- N10321 County Road K
- N3028 Clark St
- N3038 Clark St
- N3022 Clark St
- N3039 Jackson St
- N3017 Jackson St
- N3017 Jackson St
- N3047 Clark St
- N3047 Clark St
- W11403 Alderman St
- W11415 Alderman St
- N3020 Jackson St
- N3032 Jackson St
- N3042 Jackson St
- N3008 Jackson St
- W11929 W Co Road B
- N3054 Jackson St
- W11443 W Alderman St
- W11414 Alderman St
- W11404 Alderman St
- W11438 Alderman St