A
Seller's Agent in 2025
Amy Lorentz
Gerrard-Hoeschler, REALTORS
(608) 792-4604
14 in this area
58 Total Sales
Estimated Value: $117,000 - $871,000
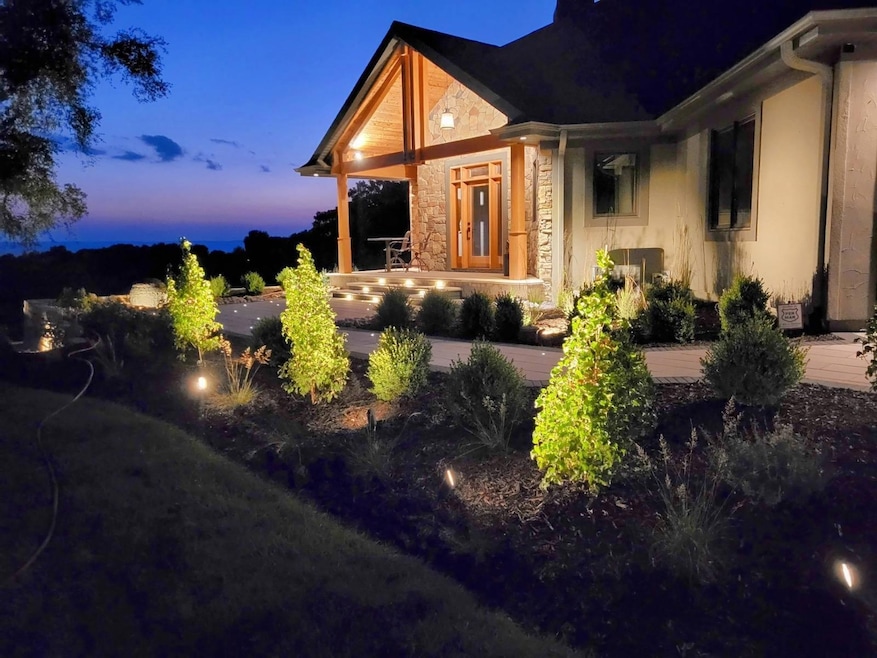
Luxury meets location on 18 acres overlooking the city of Onalaska, offering exceptional privacy minutes from schools, shopping and top golfing. Sold before going public, this fully renovated home features soaring ceilings, panoramic city and woodland views, three bedroom suites, workout room and a walkout lower level with bar and heated floors. High-end upgrades include custom cabinetry, quartz countertops, Sub-Zero/Wolf/Cove appliances, Lutron and Sonos systems, steam shower, premium landscaping, new roof, new basement windows, whole-house dehumidification and heated garagean ultra-rare retreat in an unbeatable setting.
Last Agent to Sell the Property
Gerrard-Hoeschler, REALTORS License #72578-94 Listed on: 12/04/2025
| Date | Buyer | Sale Price | Title Company |
|---|---|---|---|
| Diermeier Joint Trust | $200,000 | New Castle Title | |
| Macewen Colin | $20,000 | None Available | |
| Fuchsel Paul M | $577,200 | None Available |
| Date | Status | Borrower | Loan Amount |
|---|---|---|---|
| Previous Owner | Fuchsel Paul M | $417,000 |
| Date | Event | Price | List to Sale | Price per Sq Ft |
|---|---|---|---|---|
| 12/04/2025 12/04/25 | For Sale | $1,650,000 | +13.8% | $351 / Sq Ft |
| 12/01/2025 12/01/25 | Sold | $1,450,000 | -- | $309 / Sq Ft |
| 10/10/2025 10/10/25 | Pending | -- | -- | -- |
| Year | Tax Paid | Tax Assessment Tax Assessment Total Assessment is a certain percentage of the fair market value that is determined by local assessors to be the total taxable value of land and additions on the property. | Land | Improvement |
|---|---|---|---|---|
| 2025 | $7,430 | $517,900 | $83,100 | $434,800 |
| 2024 | $7,272 | $517,900 | $83,100 | $434,800 |
| 2023 | $6,820 | $517,900 | $83,100 | $434,800 |
| 2022 | $6,585 | $517,900 | $83,100 | $434,800 |
| 2021 | $6,247 | $517,900 | $83,100 | $434,800 |
| 2020 | $6,351 | $445,700 | $105,200 | $340,500 |
| 2019 | $6,171 | $445,700 | $105,200 | $340,500 |
| 2018 | $6,110 | $445,700 | $105,200 | $340,500 |
| 2017 | $3,768 | $276,400 | $105,200 | $171,200 |
| 2016 | $647 | $40,600 | $40,600 | $0 |
| 2015 | $650 | $40,600 | $40,600 | $0 |
| 2014 | $602 | $40,600 | $40,600 | $0 |
| 2013 | $610 | $41,000 | $41,000 | $0 |
A
Seller's Agent in 2025
Amy Lorentz
Gerrard-Hoeschler, REALTORS
(608) 792-4604
14 in this area
58 Total Sales
Source: Metro MLS
MLS Number: 1944478
APN: 009-000072-003
Disclaimer: Certain information contained herein is derived from information provided by parties other than Homes.com. All information provided is deemed reliable, but is not guaranteed to be accurate and should be independently verified.
![]() IDX information is provided exclusively for personal, non-commercial use, and may not be used for any purpose other than to identify prospective properties consumers may be interested in purchasing.
IDX information is provided exclusively for personal, non-commercial use, and may not be used for any purpose other than to identify prospective properties consumers may be interested in purchasing.
IDX listing data provided by Multiple Listing Service, Inc. Information is supplied by seller and other third parties and has not been verified.
Copyright 2026 – Multiple Listing Service, Inc. – All Rights Reserved.
Ask me questions while you tour the home.
